What’s on our mind: Google Analytics on your Koha OPAC
Last updated on: 11th September 2025| 23rd July 2025 | Lauren Purton | Koha
Why track OPAC engagement?
Tracking your library’s Koha OPAC usage gives you valuable information on user behaviour as they navigate your library’s online spaces:
- What are online visitors looking at?
- How long are visitors browsing for and where are they spending their time?
- How are visitors navigating the library’s online resources?
- What’s popular (or not!)?
Using this information, you can guide decisions about how to customise your user interfaces, which information to highlight, how to improve the user experience, the impacts of any changes (expected and unexpected), and use the information when reporting your impact and reach.
What tools can I use to track engagement?
There are numerous web analytics tools available, with a range of features and price points (starting from free!) available. Often intended for commercial uses, so some of the reports and analytics may not be relevant to libraries, and paid-for versions can get very expensive.
Two options that are widely used on websites and that we are aware of our customer libraries using are Google Analytics (proprietary) and Matomo (open source).
Google Analytics
- Widely used across websites and freely available.
- Google Analytics 4 (GA4) Standard is free.
- Basic dashboard provides information on: number of visitors, time spent on webpages, bounce rate, most visited pages, sources of traffic, and so on.
- View of daily, weekly, monthly, seasonal trends.
- Not inherently GDPR compliant / non-compliant.
Matomo
- Most widely used web analytics tool that is free to use and open source.
- Formerly ‘Piwik’, renamed in 2018.
- Option to self-host, with hosting and support plans available at a cost from providers.
- Advanced privacy controls and GDPR management, although this will still need to be managed by administrators / staff for compliance.
- Additional features, such as heat-maps, branding and analytics options.
Important considerations when looking at tracking tools
Policies – Review the tools policies to ensure they conform to your institution’s policies and guidance, particularly around privacy.
GDPR – The tool may not be inherently compliant or non-compliant with GDPR – how you use it will influence this.
Ensure appropriate user consents are in place, do not collect more data than necessary or store it for longer than needed.
Identifying information can include IP addresses, location, and tracked user information.
Review your settings for compliance.
Cookies and Consents
Google Analytics ‘GA4 JavaScript tags’ use first-party cookies to distinguish users and sessions. Find out more about cookies settings and how to manage them:
- Developers – Google: Cookies and user identification
- Analytics Help: Set up Cookie Information to obtain user consent.
Here’s how to review and update your OPAC cookie consents:
What to Track
In June 2025, we held an Open Discussion for Open Fifth customers to share information and practices on what engagement tracking tools are in use and how they are used. Here’s a summary of what our library customers are interested in tracking:
- Who is using the catalogue
- Cost per visit
- Website KPIs
- Some institutions track geographic location of users to justify resources on library service
- Geographical tracking is also used to track the effectiveness of campaigns and efforts to increase visibility of collections in different countries or regions
- A-Z of databases.
Below are relevant Google Analytics metrics and reports:
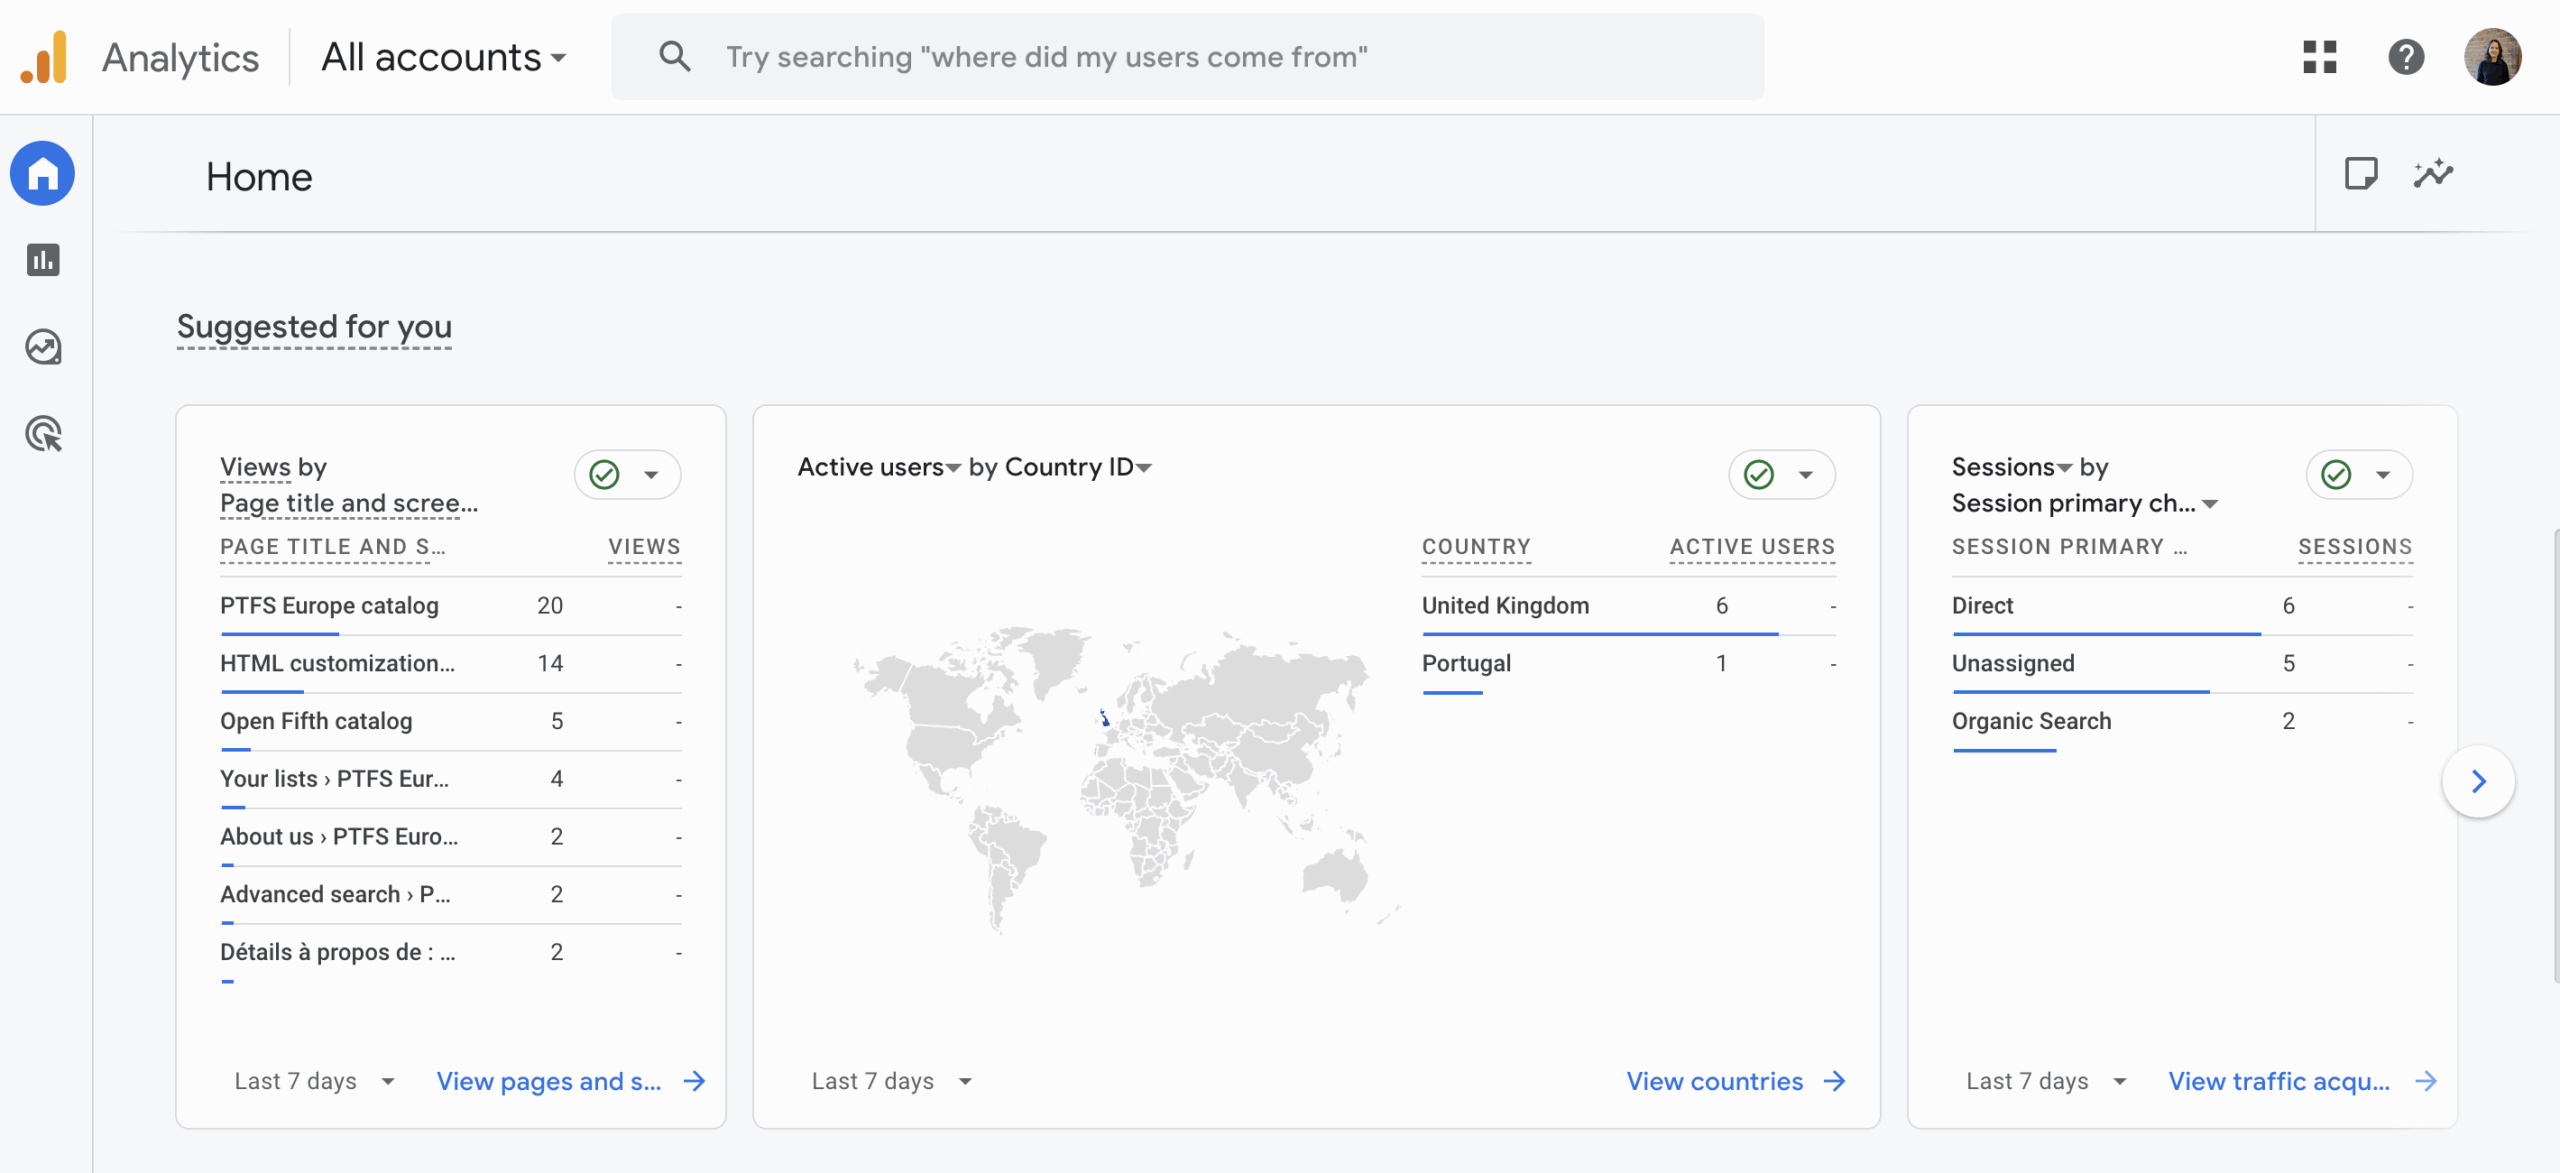
You can set the metrics up on your dashboard for an instant view, they may automatically show up on the homepage under ‘Suggested for you’.
Overall traffic and traffic sources: To understand how many visits your OPAC is getting and how they reached the site.
Reports > Generate leads > Audiences
Reports > Generate leads > Traffic acquisition
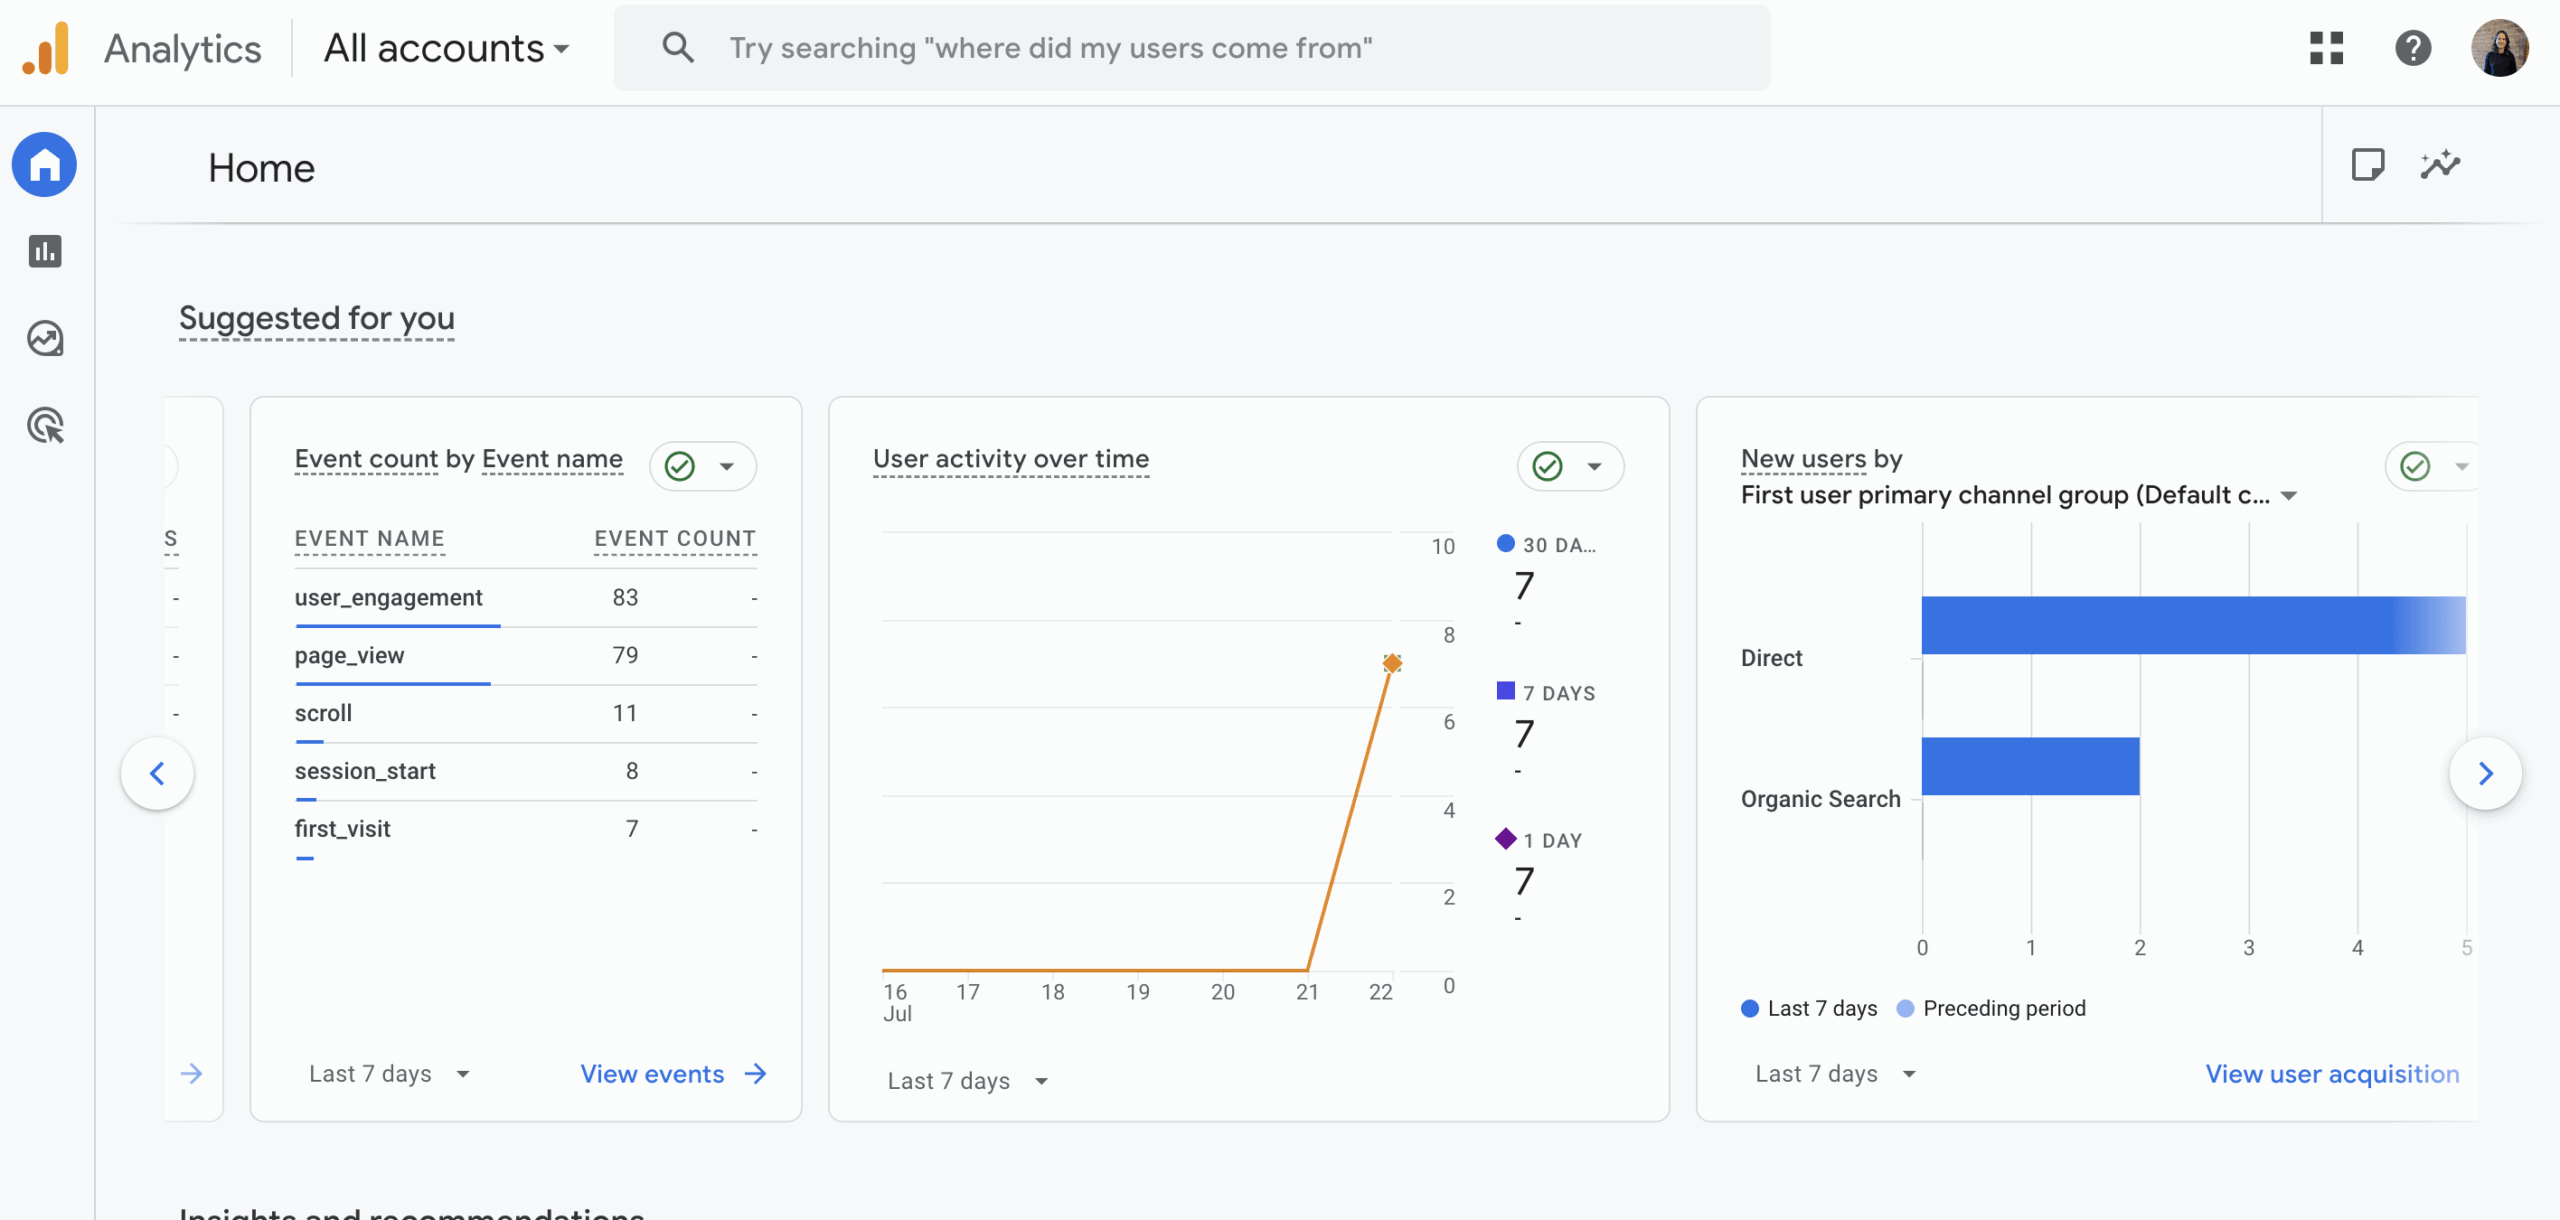
Engagement time: This shows how long visitors have spent navigating your website – are they finding what they’re looking for and interested in the information shared?
Reports > Understand web and/or app traffic > Overview > ‘Average engagement time per active user’
Page views: Find out which pages visitors are most interested in and what content to focus on.
Reports > View user engagement and retention > Pages and screens
Landing page: This shows what your visitors first see when they land on your OPAC, what information is there and how long they stay.
Reports > Generate leads > Landing page
Devices: Use the ‘Tech Overview’ to see what devices visitors are accessing the OPAC from. If most visitors are using mobile, you can enhance your OPAC to optimise for them.
Reports > Tech > Overview
Audience location: If you have location data collection turned on, check out the visitor locations to see your OPAC’s reach. (If collecting location data, ensure you are giving users the opportunity to opt-out and observe GDPR compliance.)
Reports > User attributes > Overview
Reporting
From our Open Discussion, we know that many customers are interested in tracking engagement, either starting to collect data or increasing how they manage what they collect. Collecting and interpreting OPAC data gives more tools and data for when libraries need it, such as showing value to stakeholders, preparing for future requests, and demonstrating reach, impact, and continued relevance of the library service in changing contexts.
Google Analytics has built-in reports to simplify this process, but you can also create your own bespoke to your library’s needs, and export data to apply it to existing reporting formats.
How to add Google Analytics to your Koha OPAC
If you’re an Open Fifth customer, remember you can always submit a support ticket to request Google Analytics for your Koha OPAC.
1. Visit the Google Analytics webpage and set up an account if you do not already have one.
Note: The Google Developers area includes handy guides and introductions on using Google Analytics.
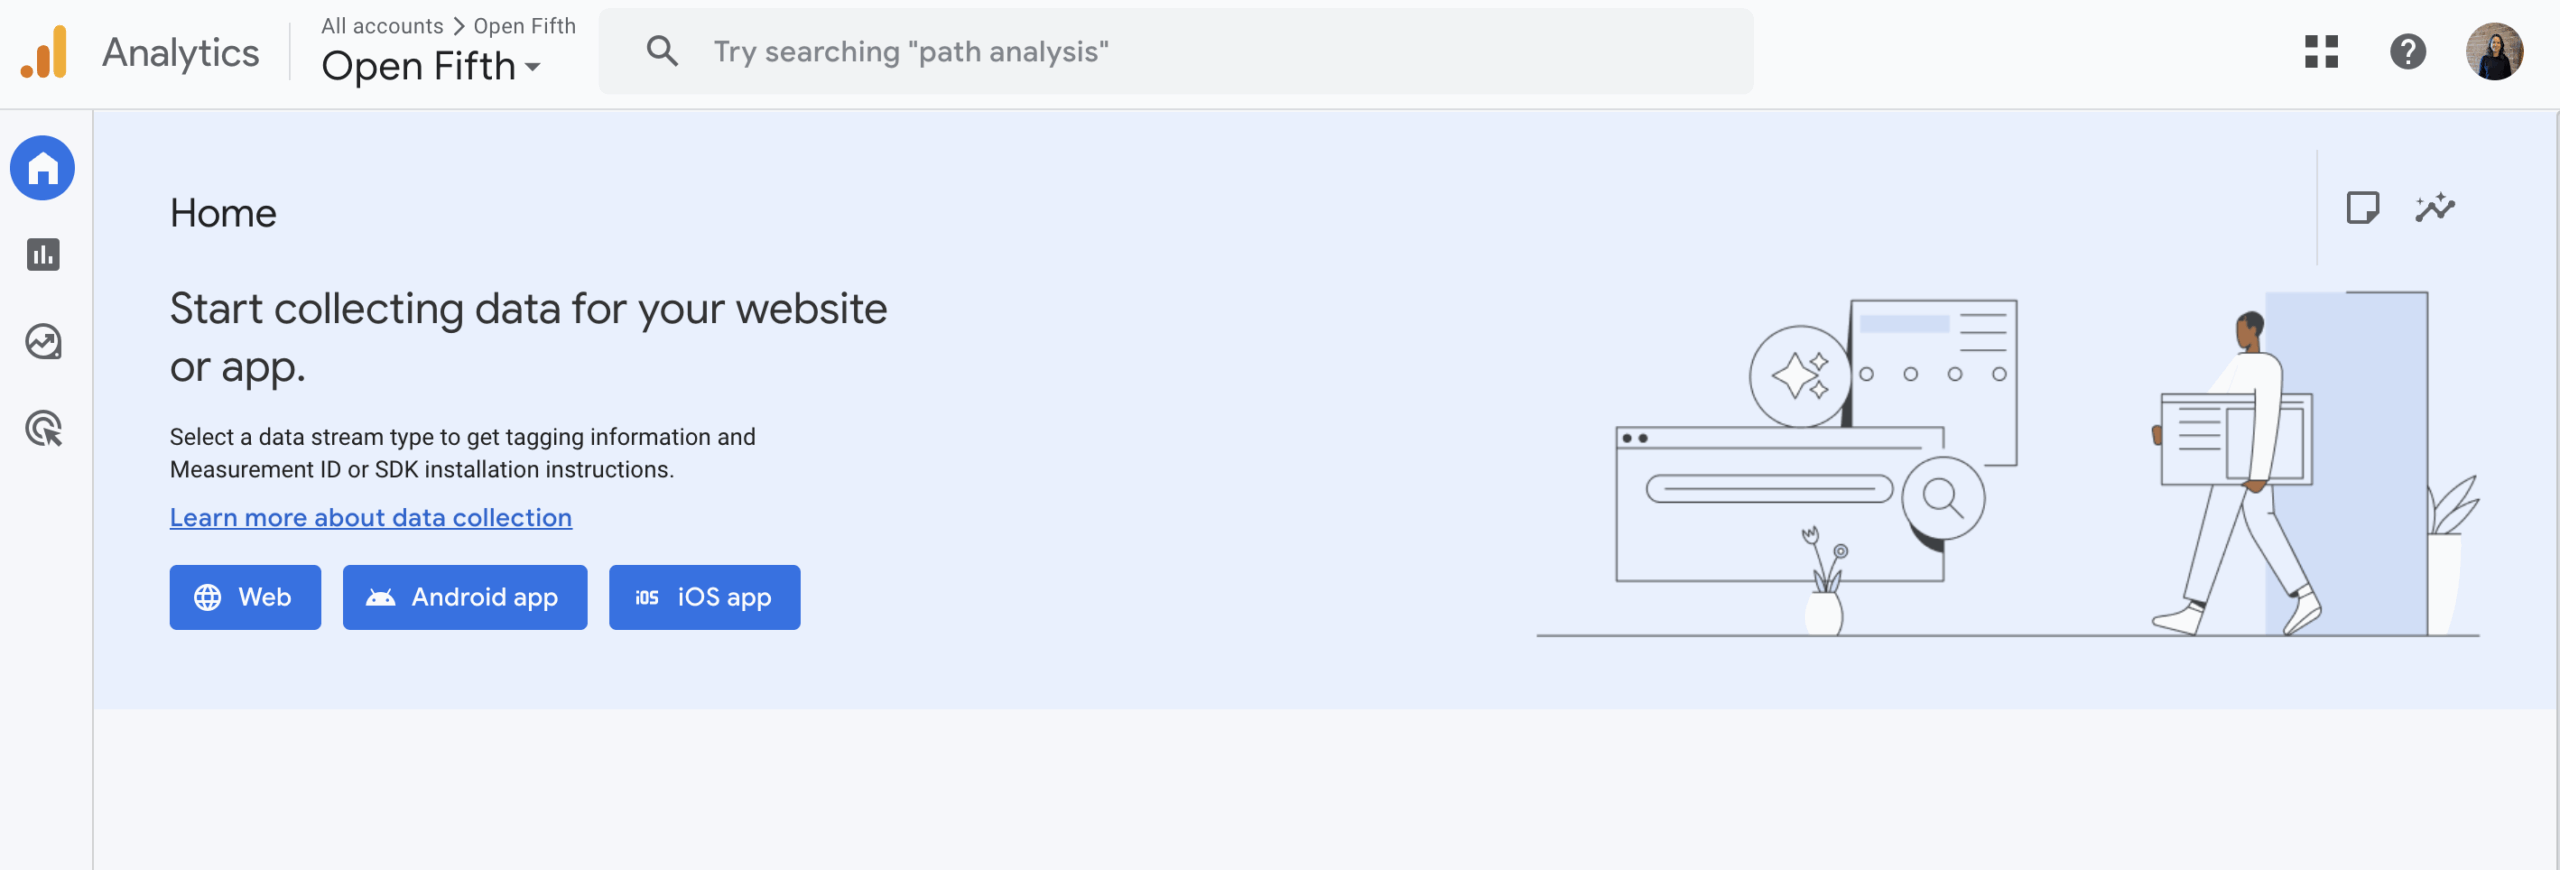
2. Once you have created your account and logged in, it’s time to create your first Google Tag. Click the ‘Start measuring’ button.
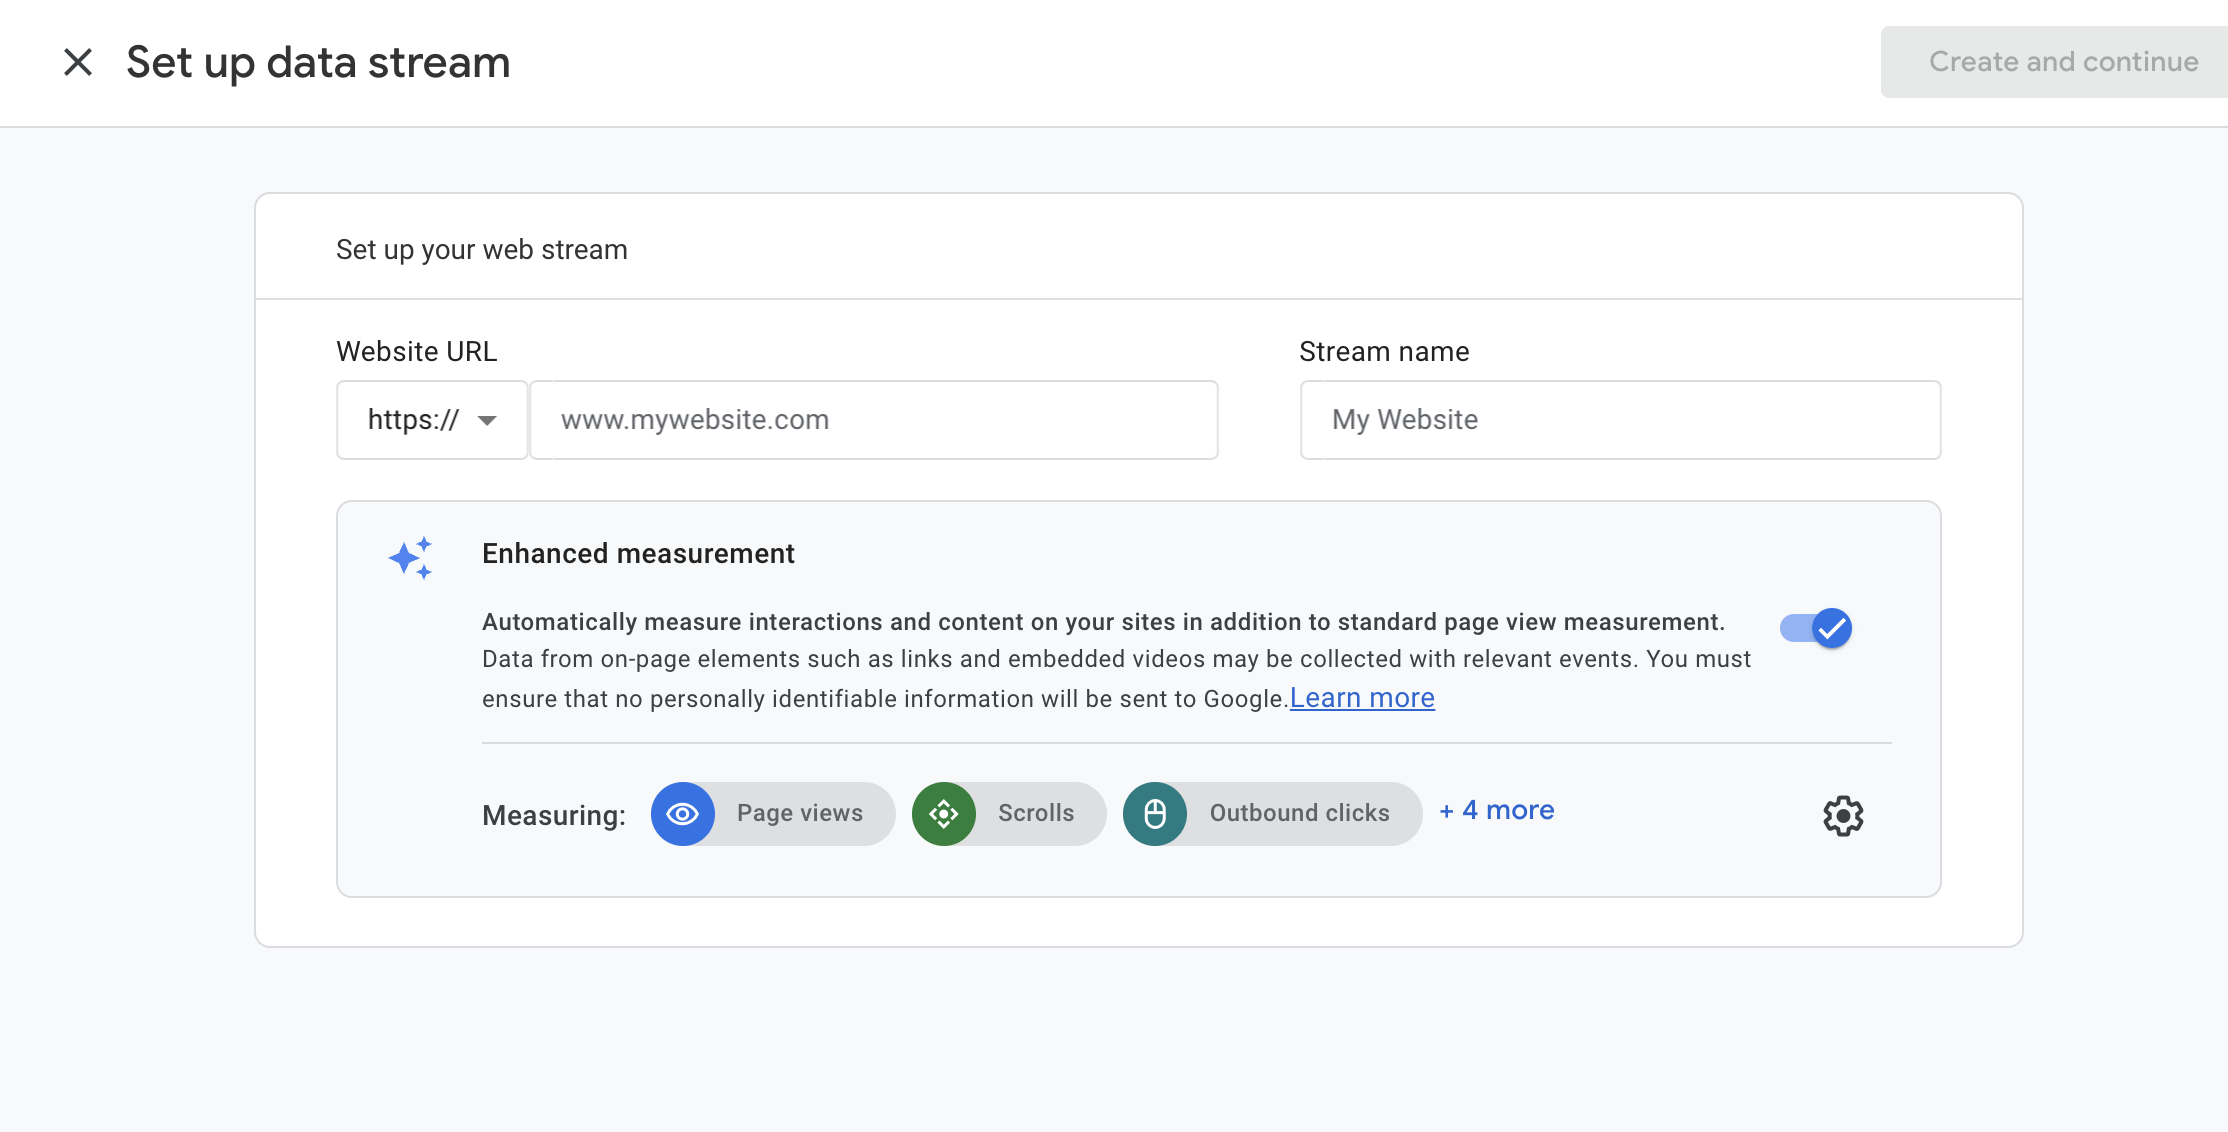
3. For your OPAC, select the ‘Web’ option. Enter the URL for your library’s Koha OPAC under ‘Website URL’ and enter a name for this stream under ‘Stream name’.
For this guide, we’ve used the URL for the Open Fifth demo Koha system and named it ‘Open Fifth Koha demo’.
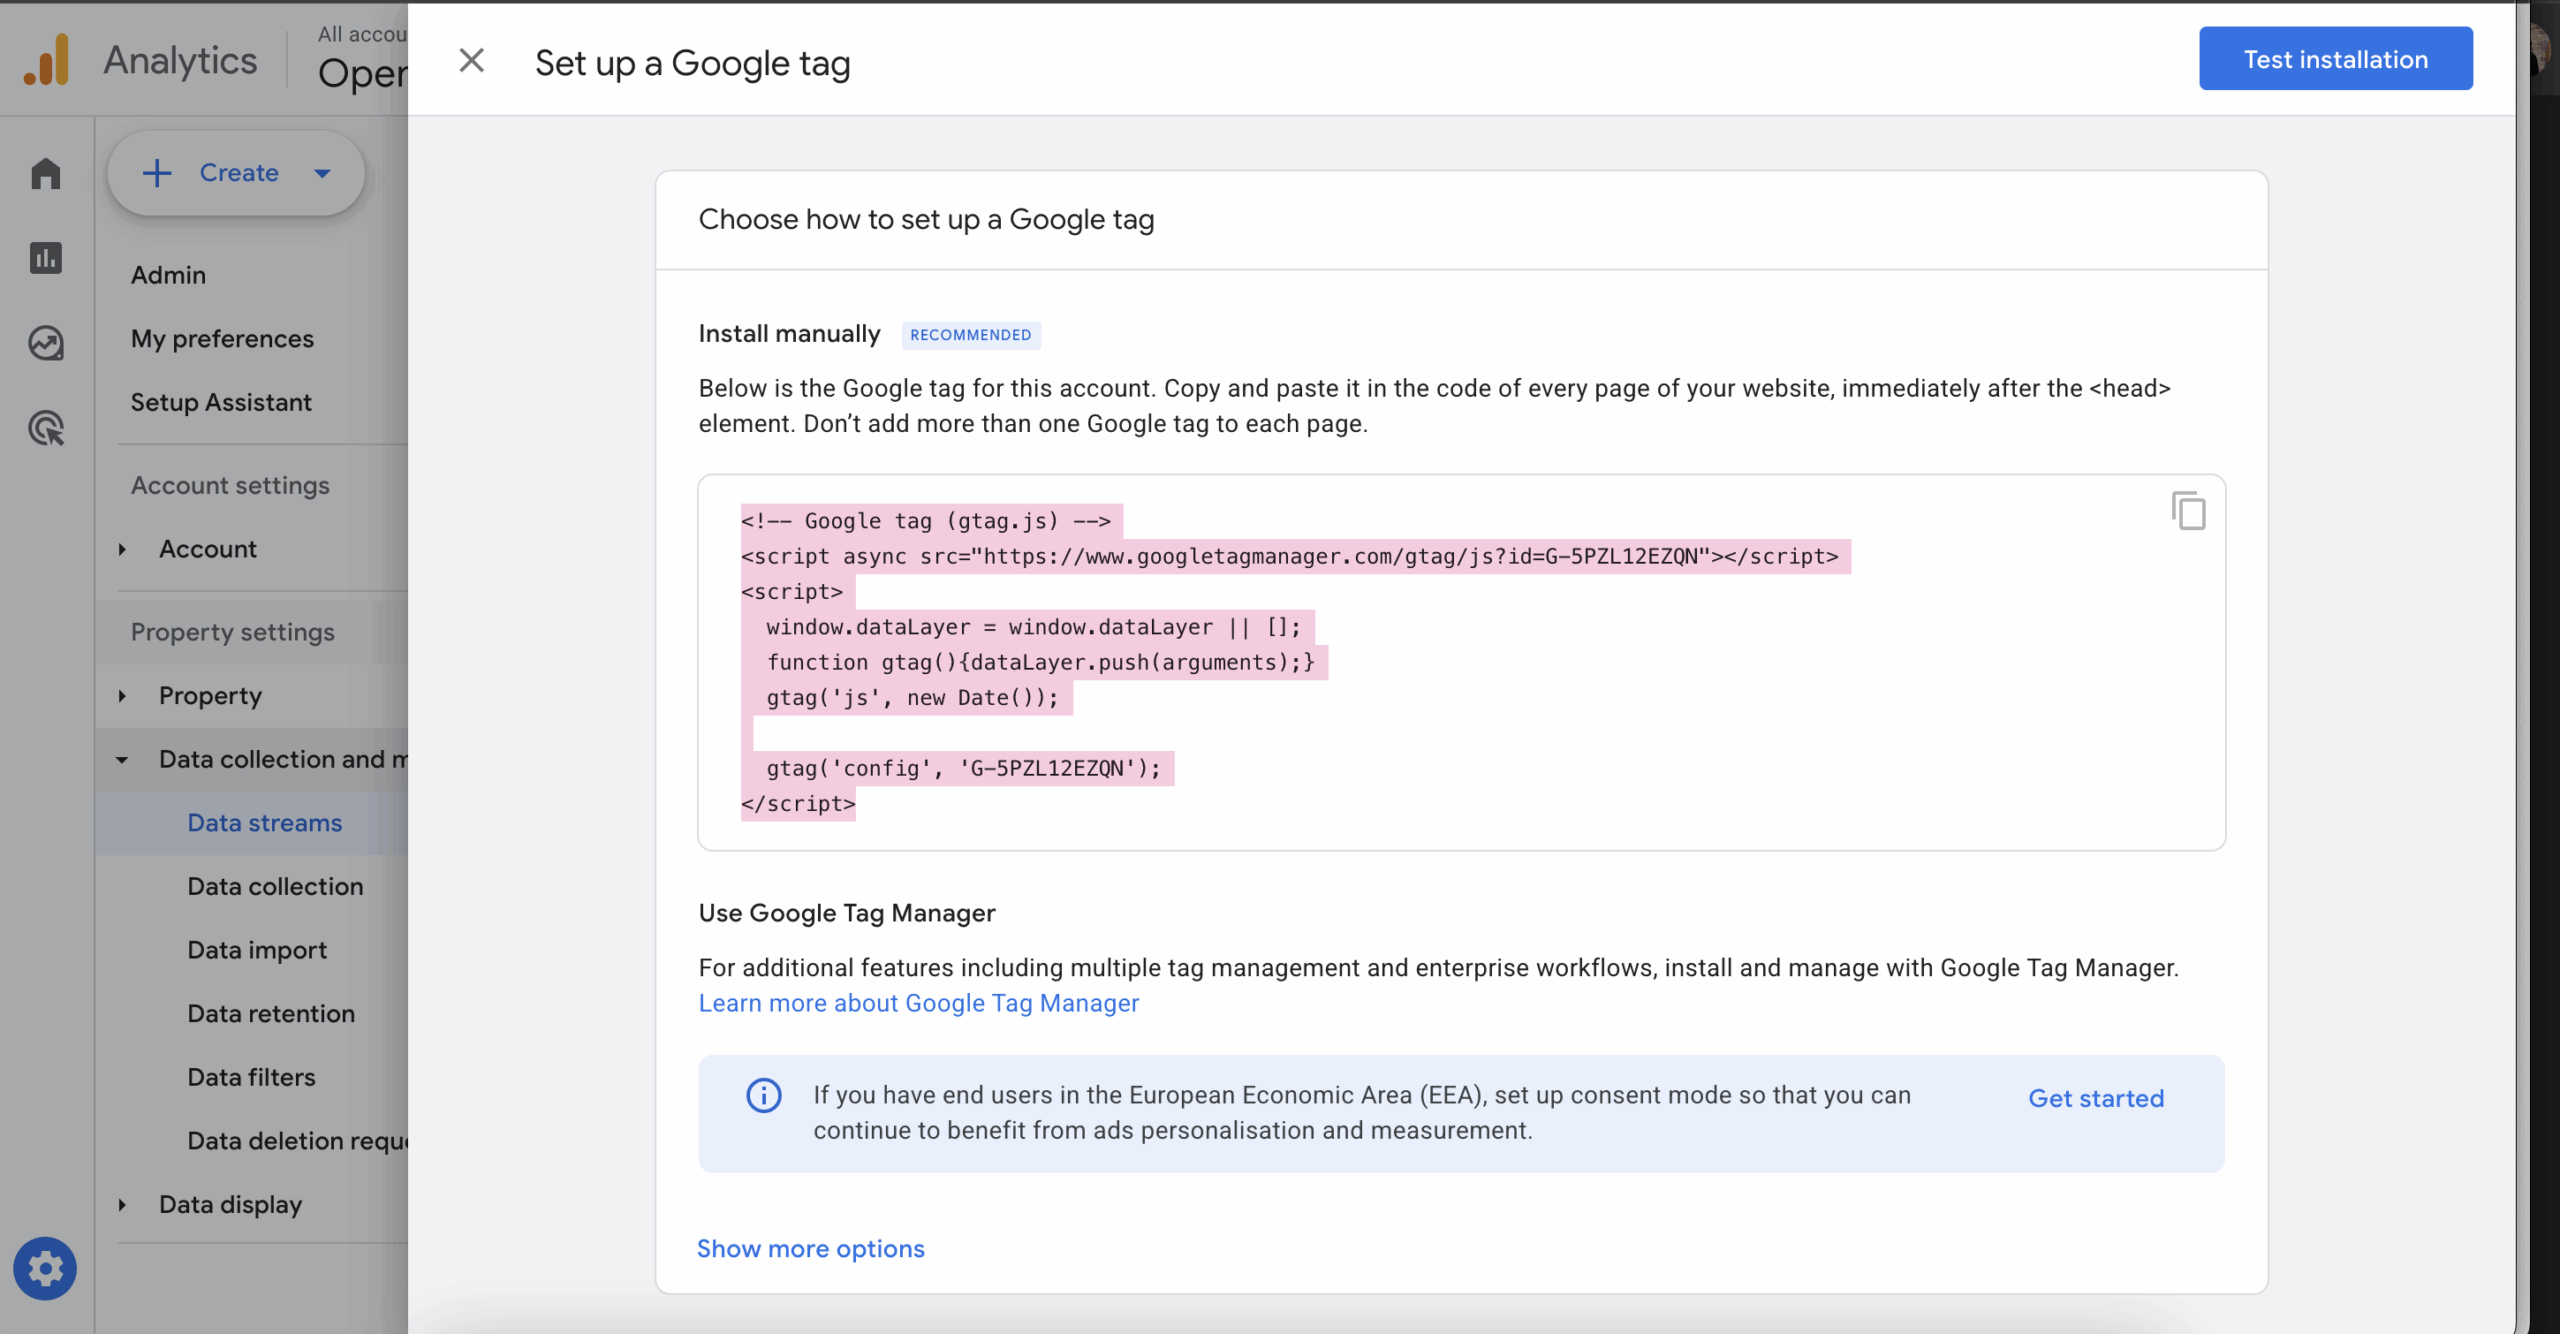
4. Your Google Tag should now be created. This is a short piece of code, copy this.
5. Log in to the Koha staff interface.
6. From the homepage, select Tools then HTML Customization.
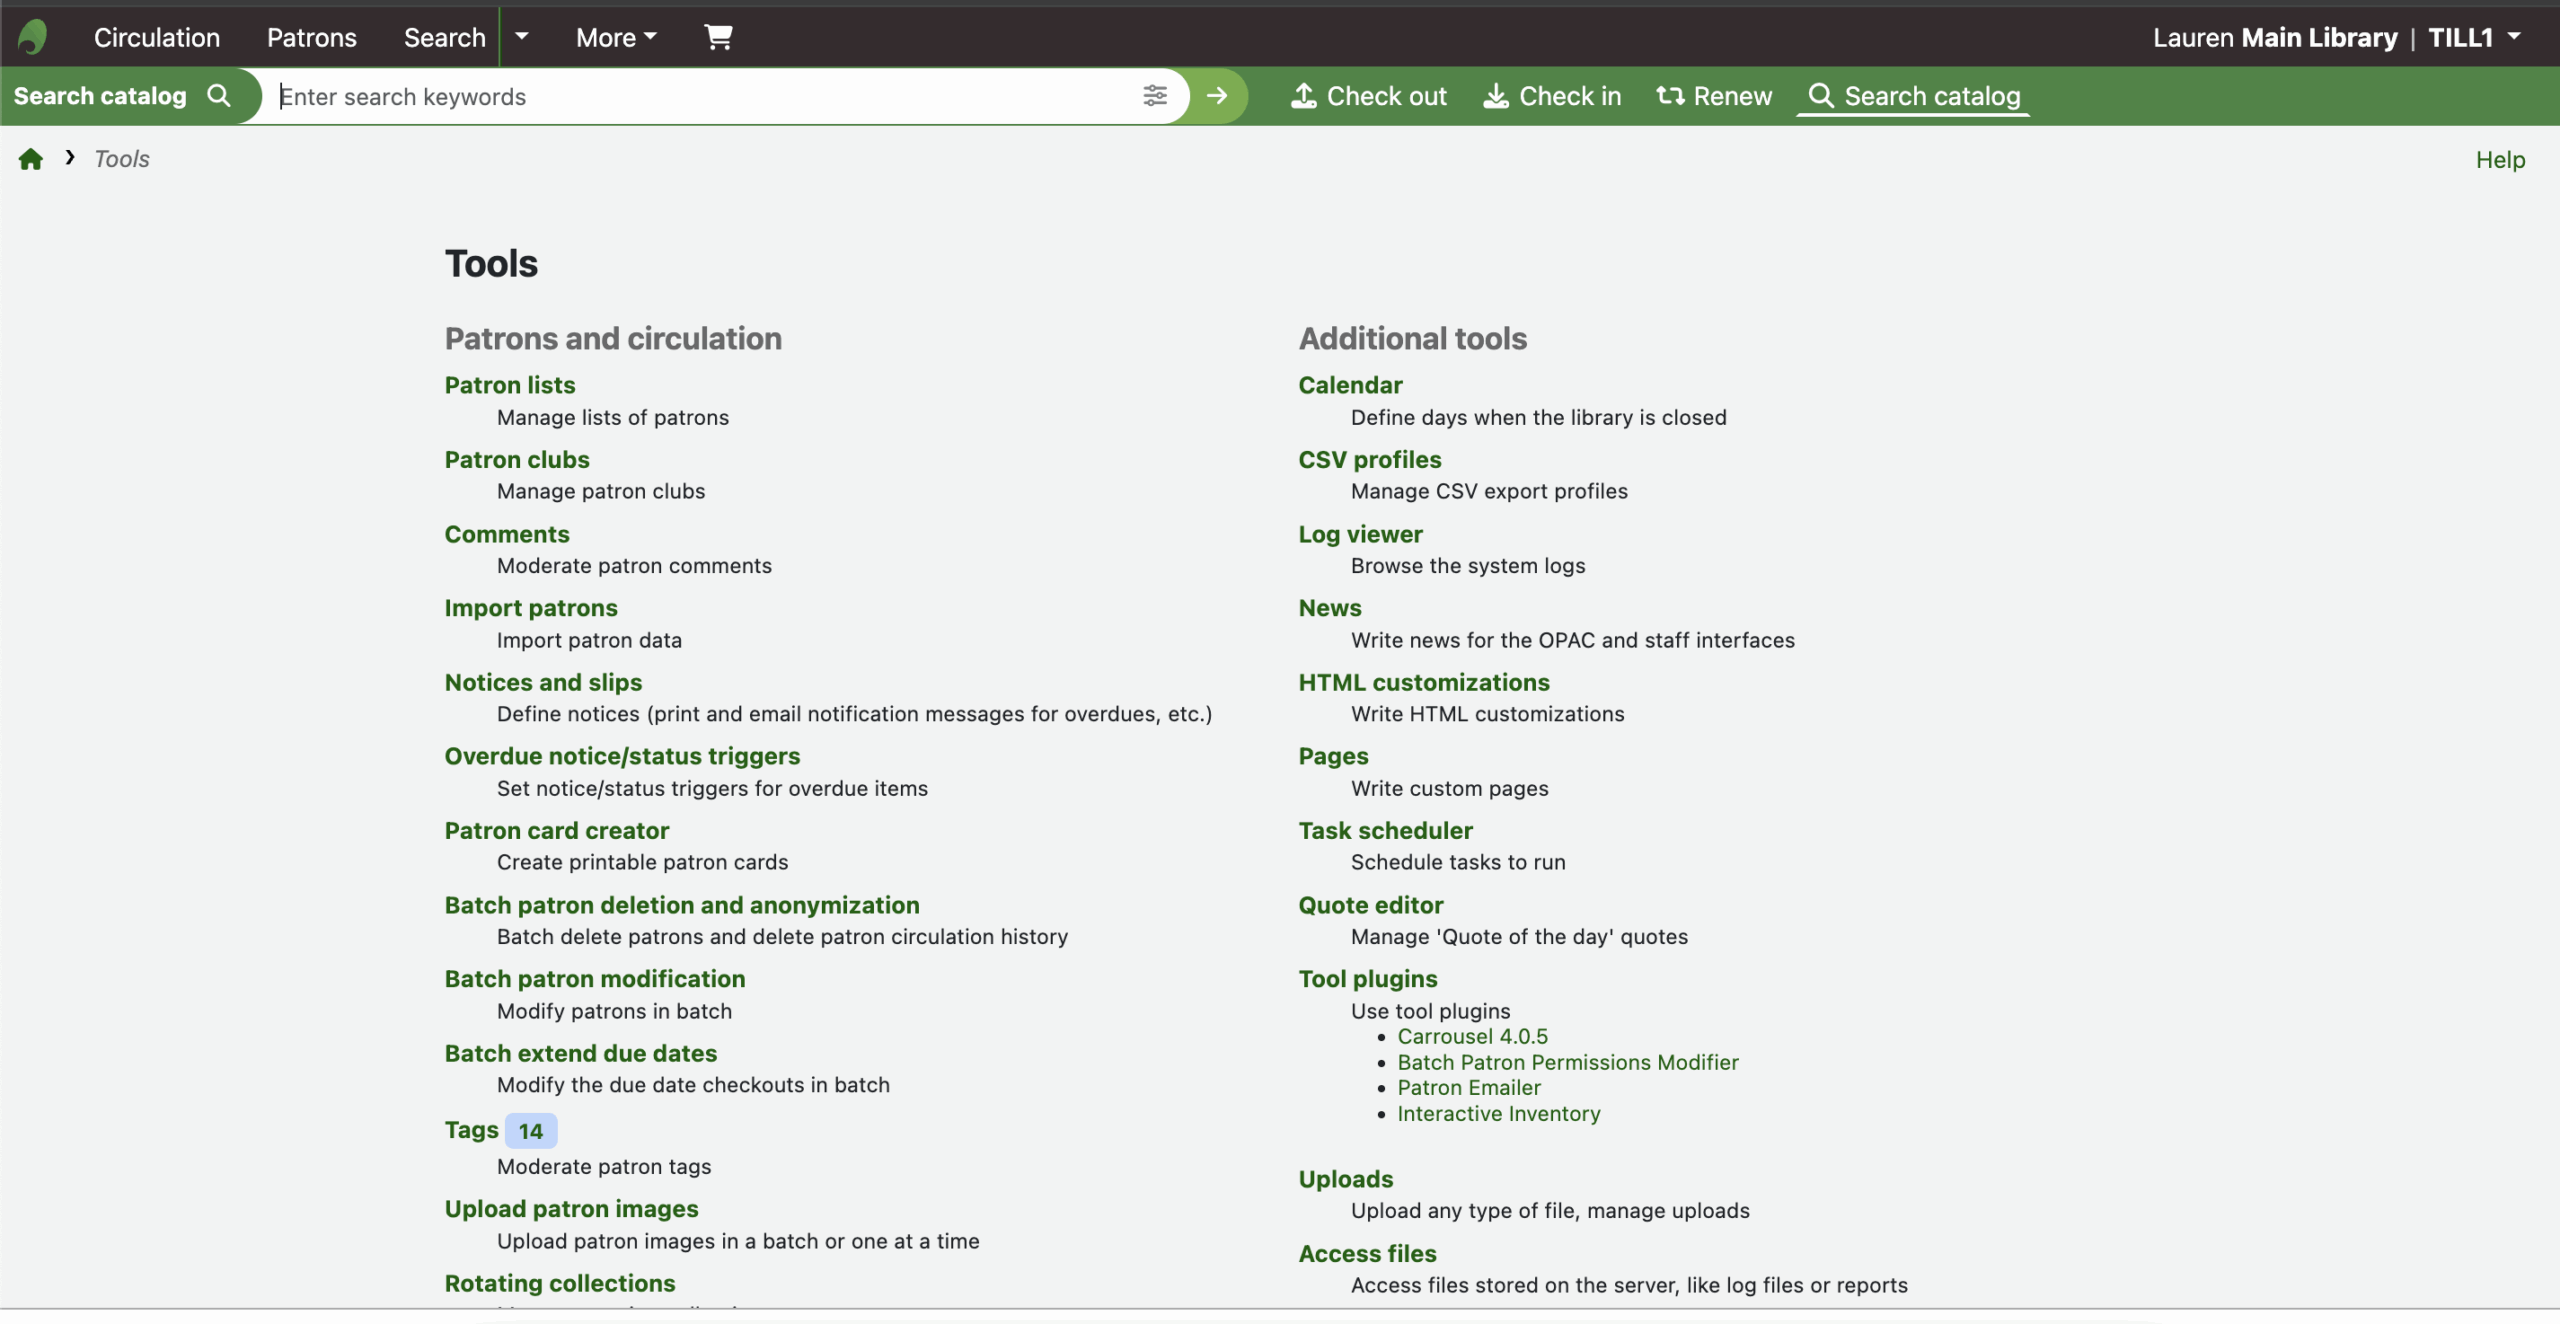
7. On the HTML Customization page, find the location ‘opacheader’.

Note: If you have many customisations on your Koha system, you may need to navigate to the next page or use the in-table search function.
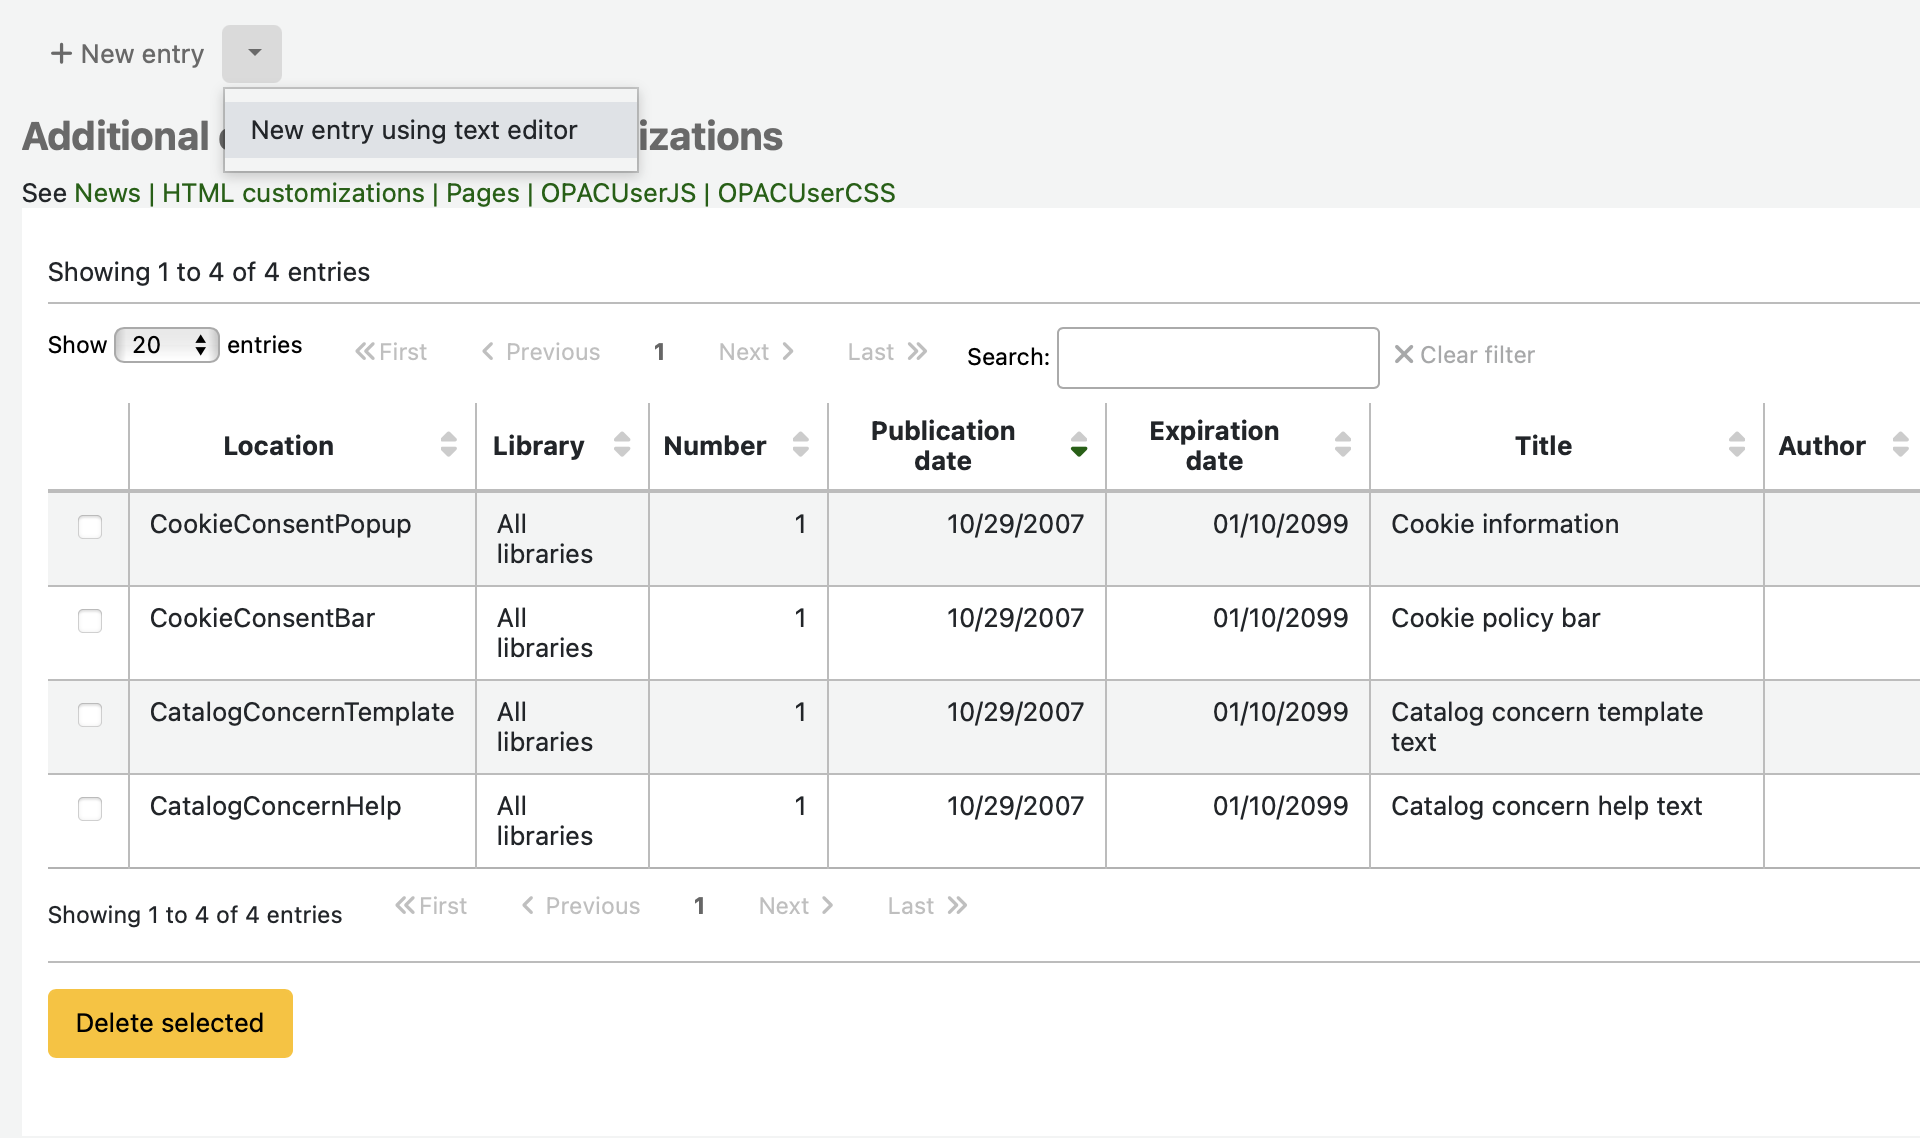
Can’t see the ‘opacheader’ option? A freshly installed version of Koha won’t have a preexisting HTML Customisation in that location. So if there isn’t one there already, the Administrator will need to select the drop down arrow next to ‘New’ on that same page, and then pick ‘New with text editor’. Once they have the new editor open, they’ll then be able to pick opacheader from the available unused locations. The publication date should be set to the current date or a date in the past for the Google tag to start working.

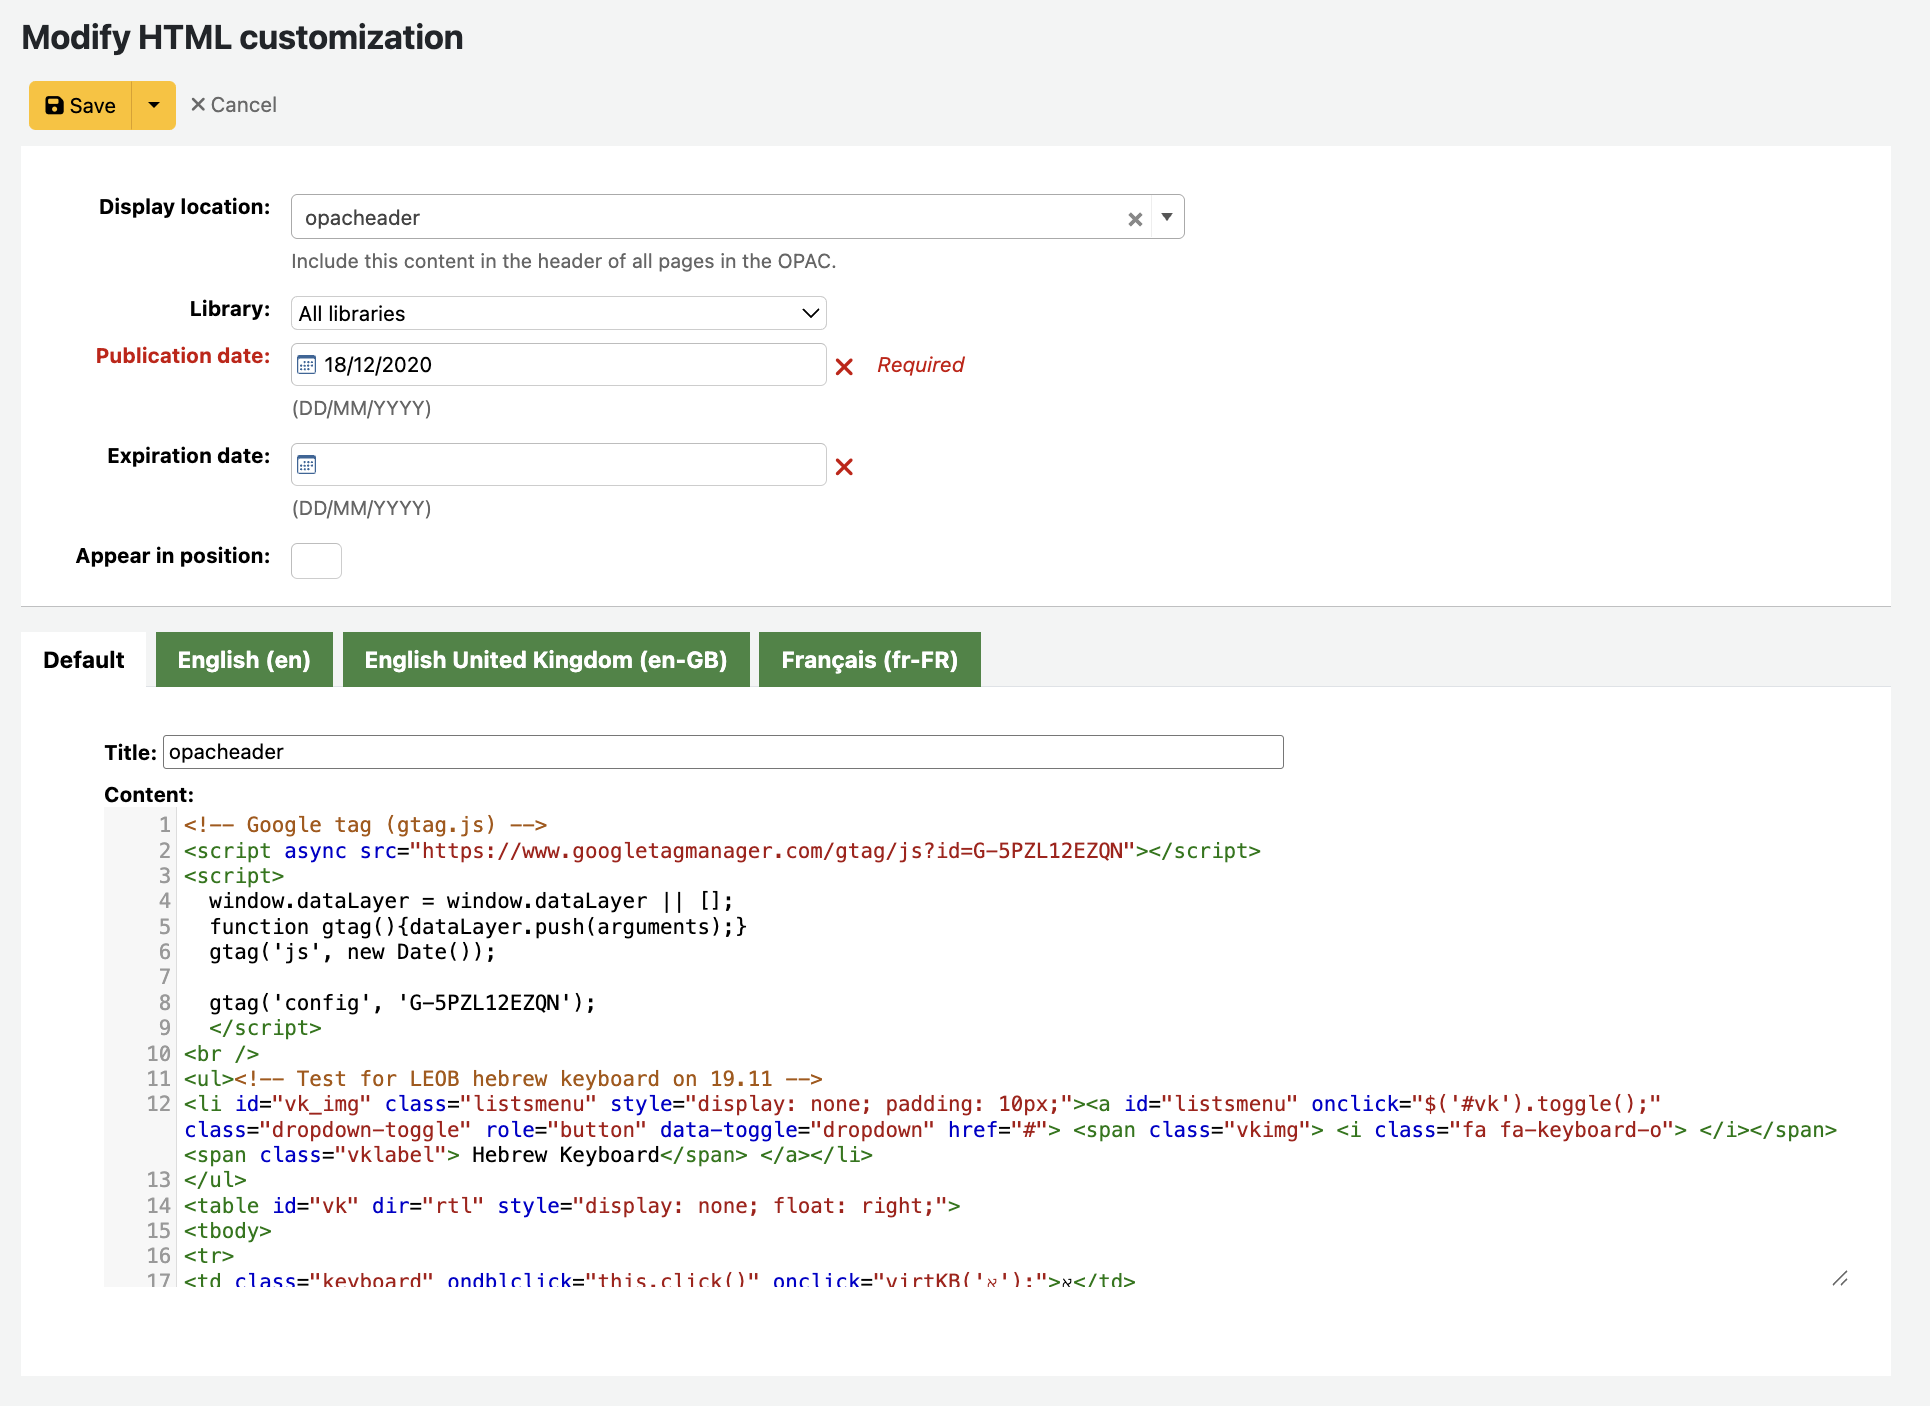
8. Once you’ve found ‘opacheader’, click the arrow next to the Edit button in the Actions column and select ‘Edit with text editor’.

9. In the opacheader text editor, paste the Google tag you just created at the top of the editor box, in front of any existing code. Click Save.
10. On Google Analytics, you can ‘Test your website’ to see if the data stream is connected yet. Don’t worry if it doesn’t show up immediately, it can take a couple of hours.
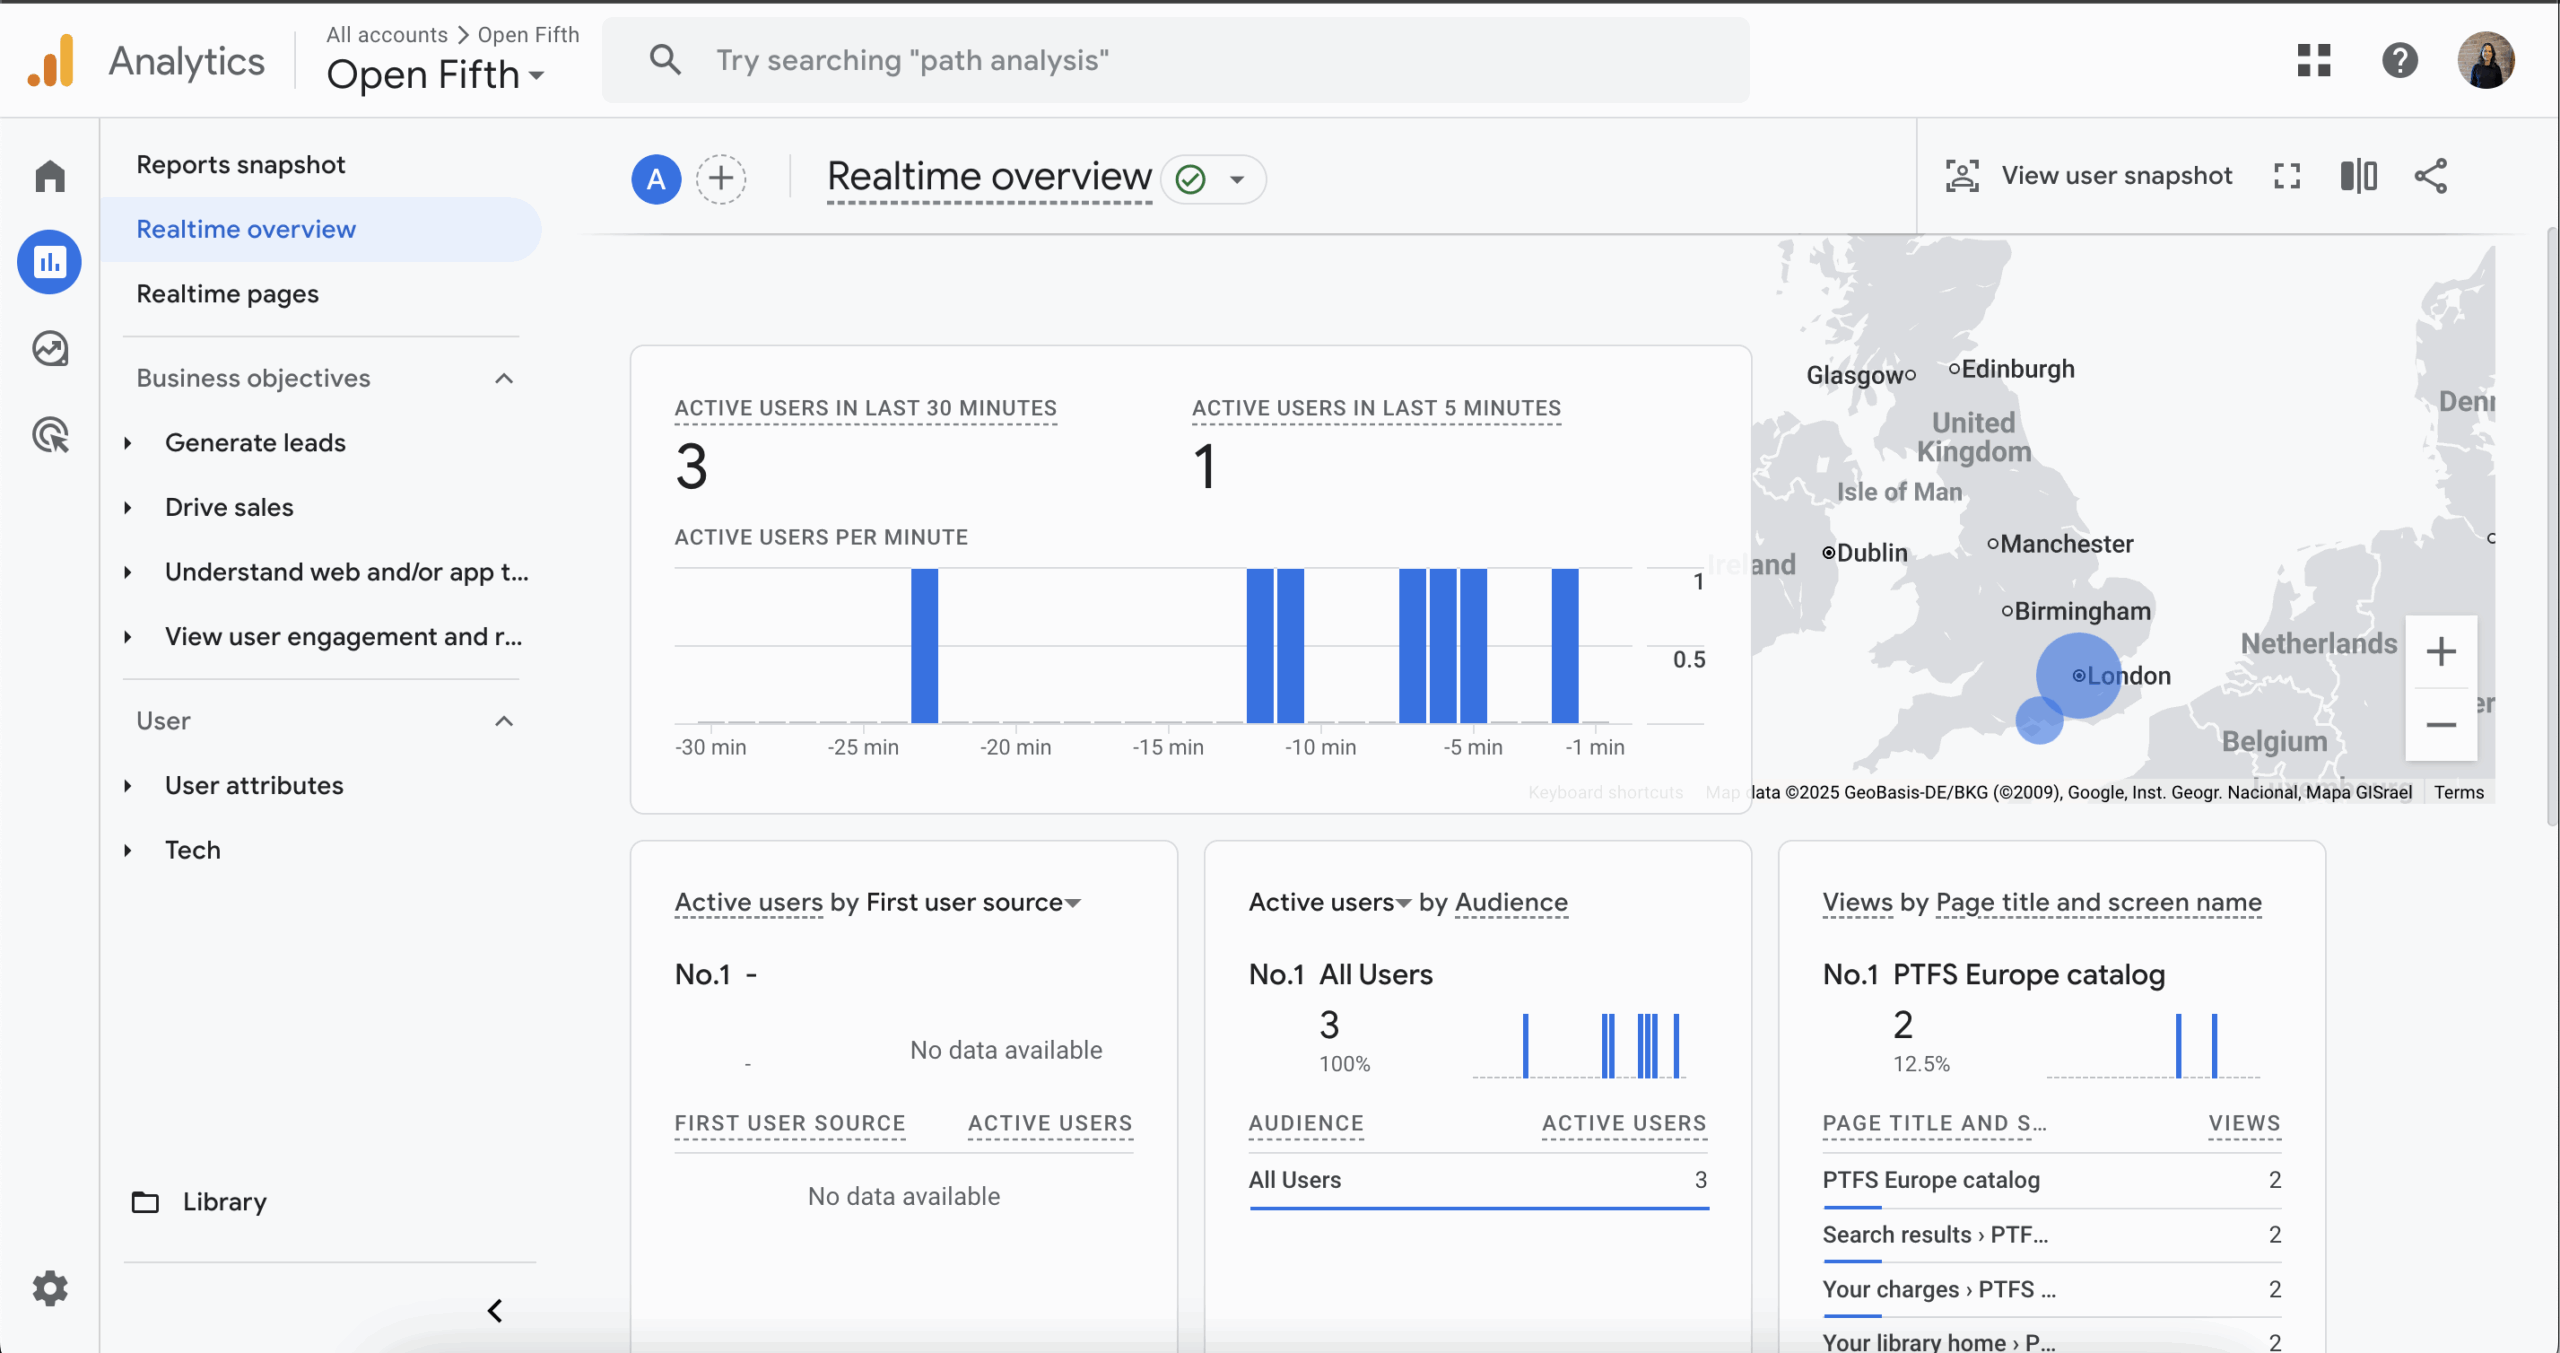
11. Once the Google tag is connected and data is flowing, your Google Analytics dashboard should start lighting up. Visit your Google Analytics homepage and take a look around to learn about the features, data options, reporting and views.
Multiple branches or authorities
If you have different URLs across branches and have multiple opacheader entries, you will need to repeat this process with a separate Google tag for each site, however you can still monitor them on a single account.
Settings
It’s important to familiarise yourself with the settings and policies for any tracking tool that you use to ensure that they are compliant with your institution’s policies as well as GDPR and other legislation. Ensure that you are not collecting any data that you don’t have permission for or that is not needed.
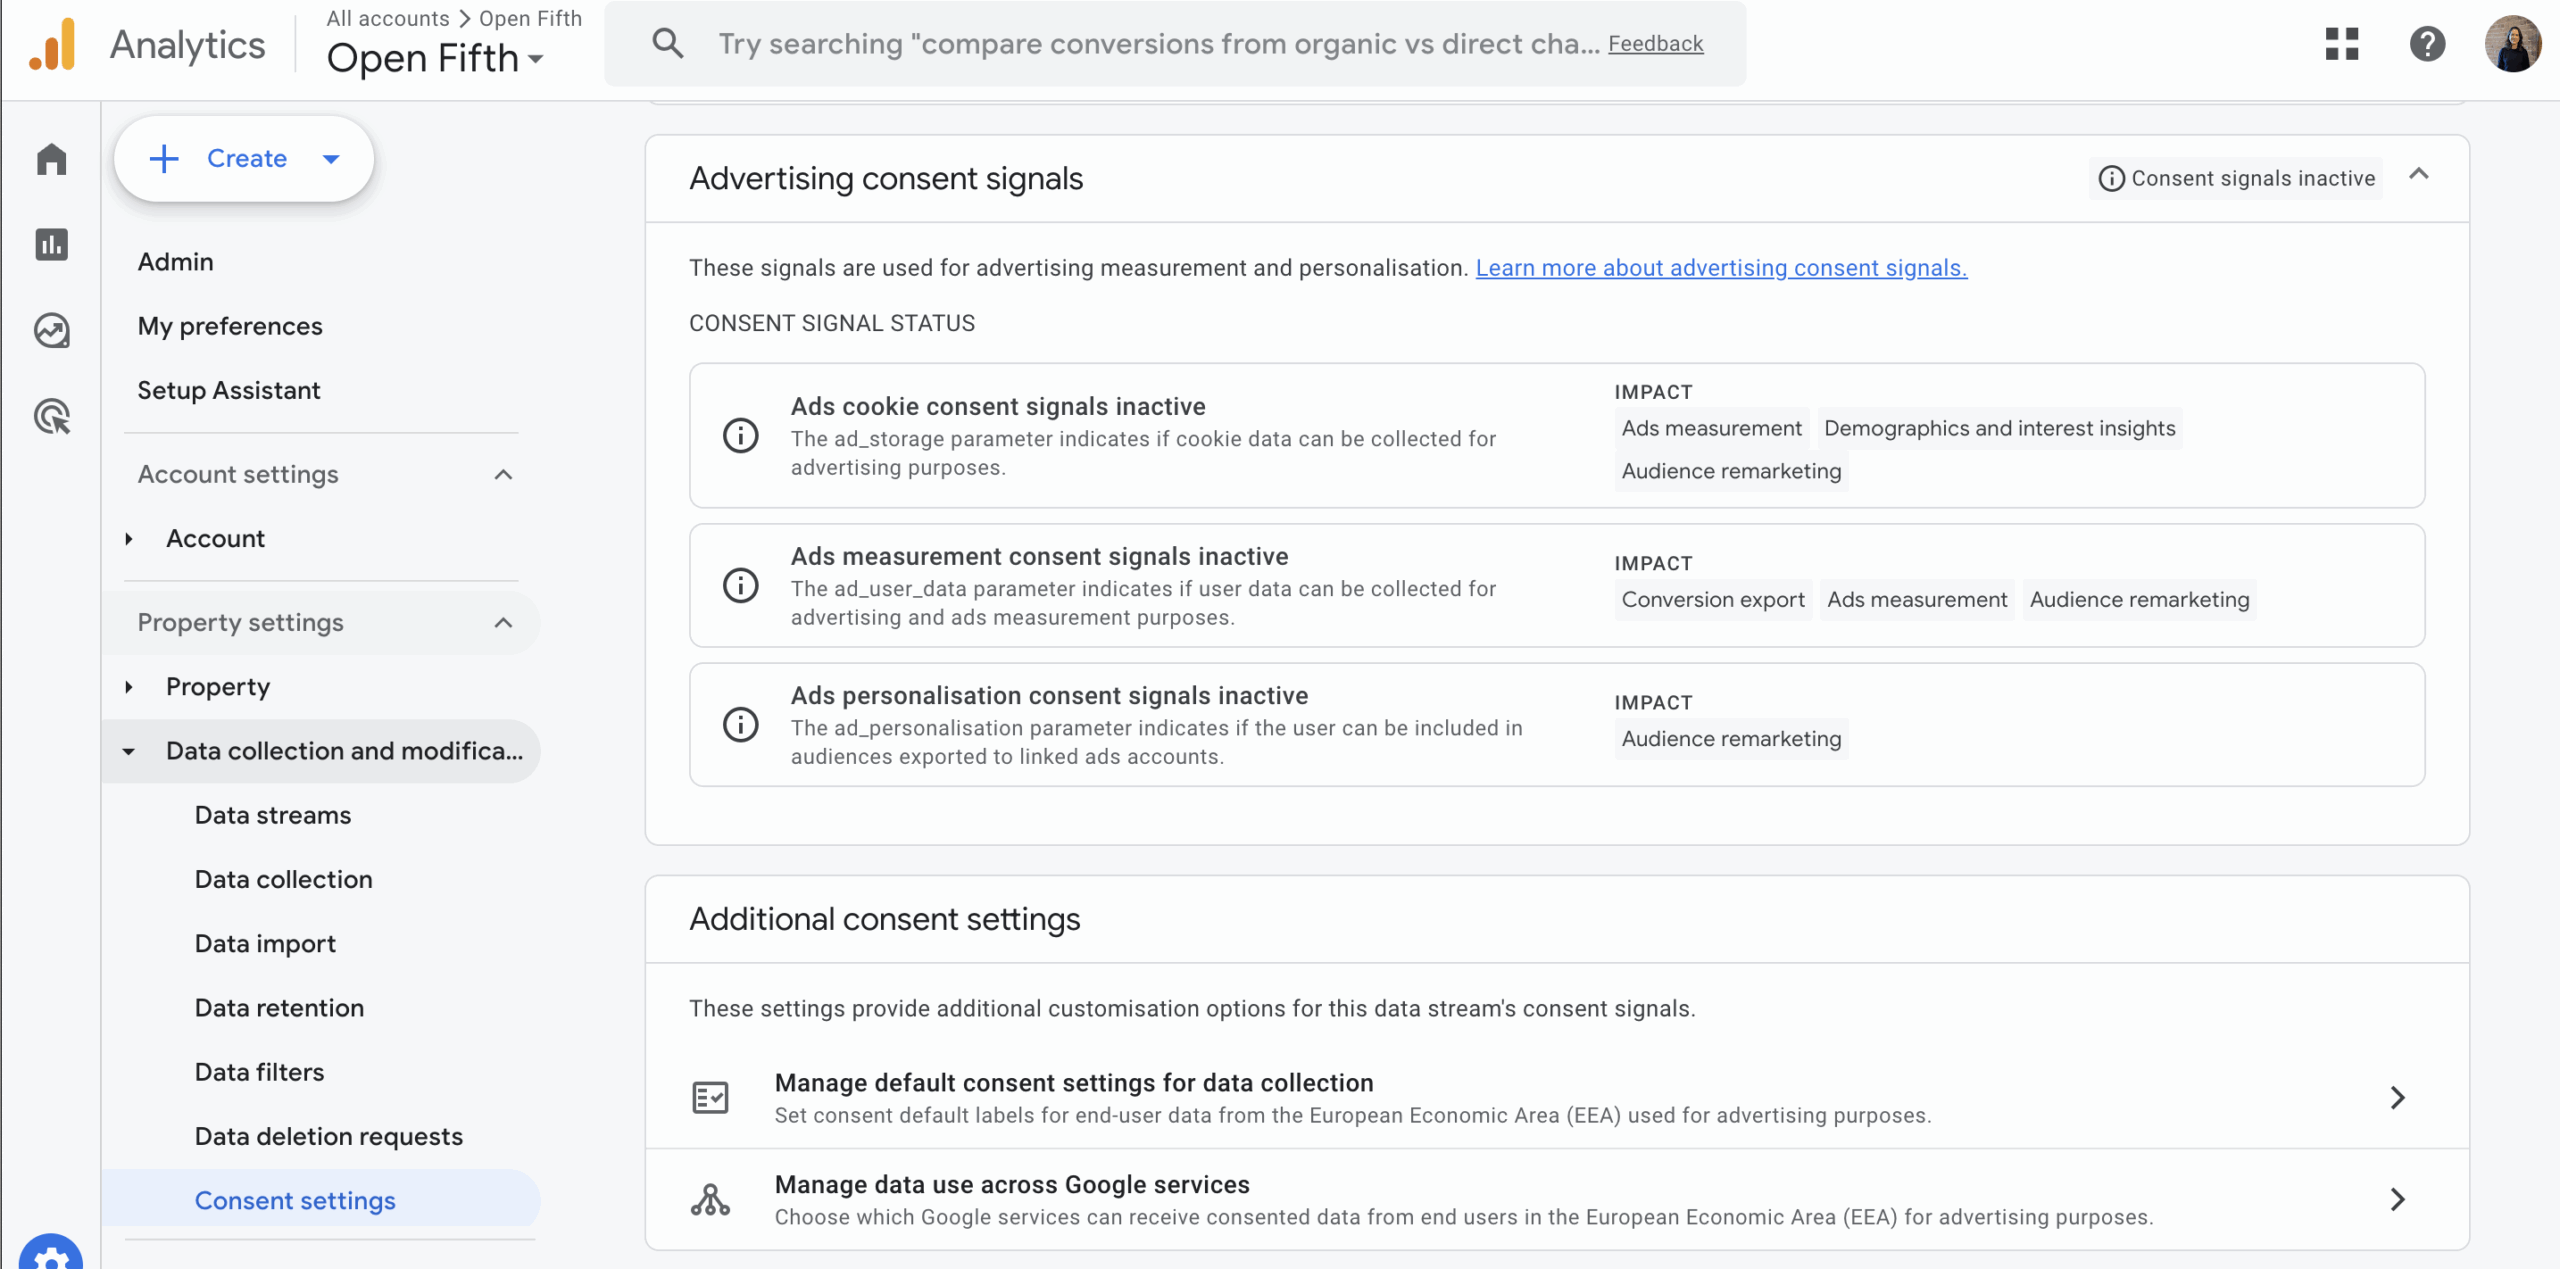
You can view and manage consents on Google Analytics:
Admin > Property Settings > Data collection and modification > Consent settings.
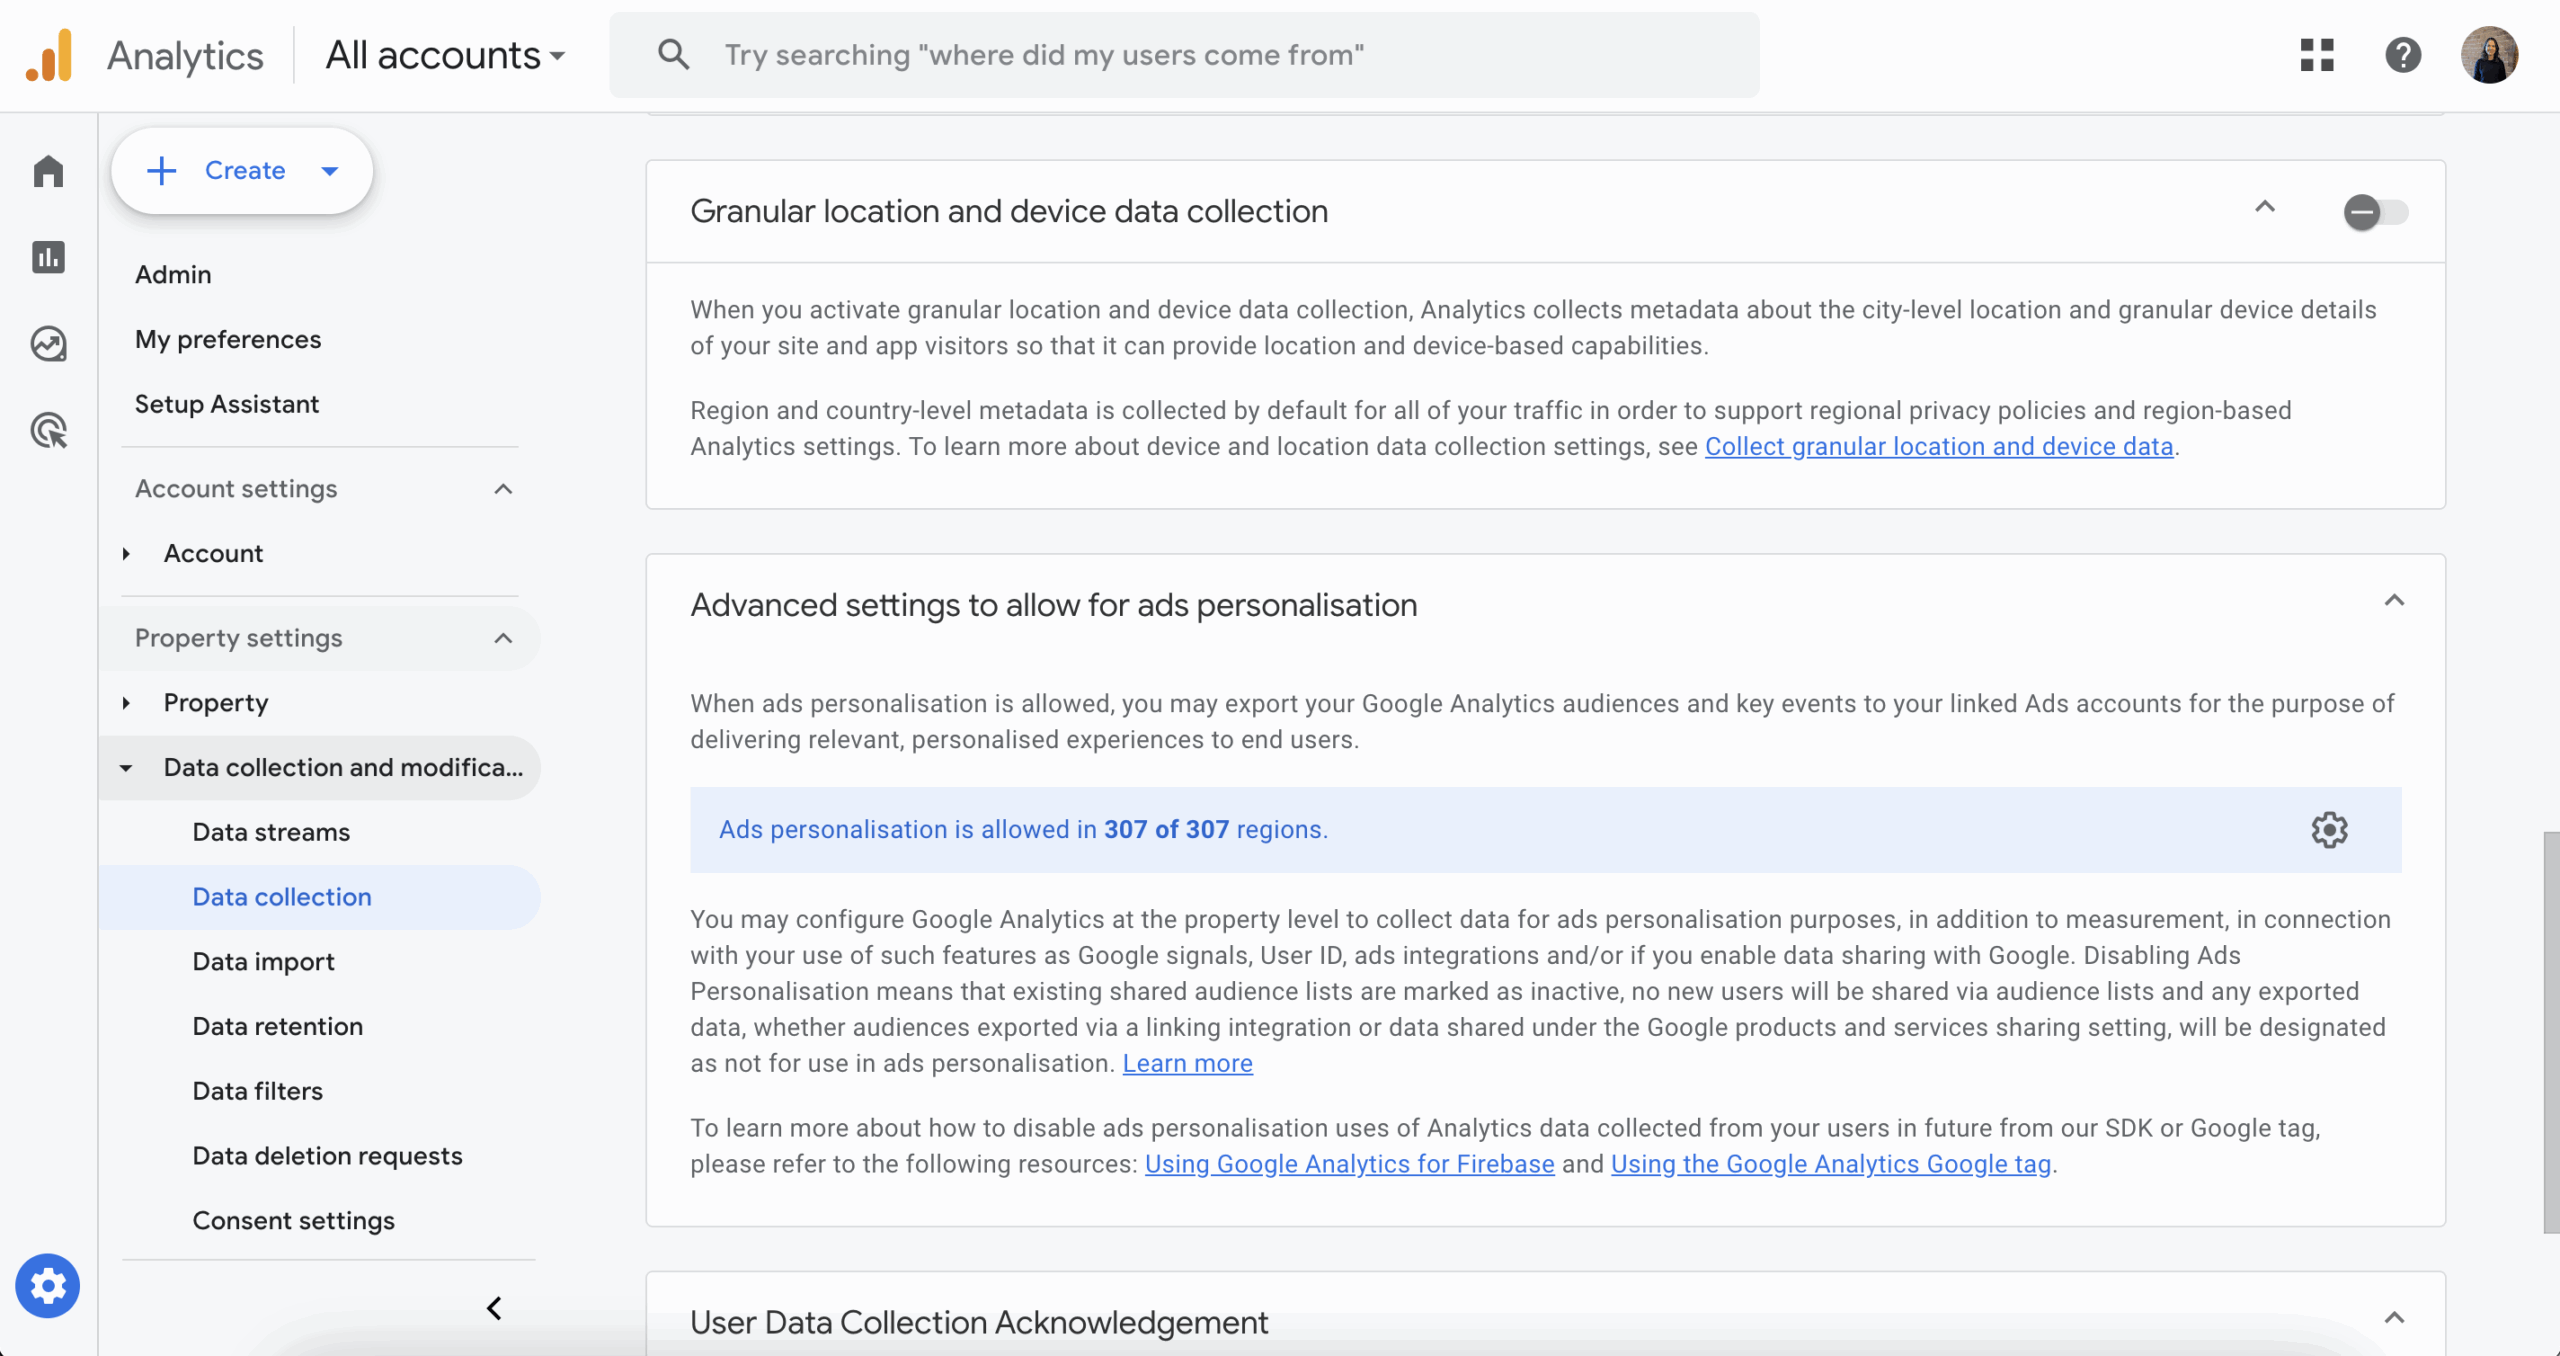
You can control settings by visiting Admin > Data collection.
From here, you can disable collection of granular location and device data details and review the ads personalisation configuration.
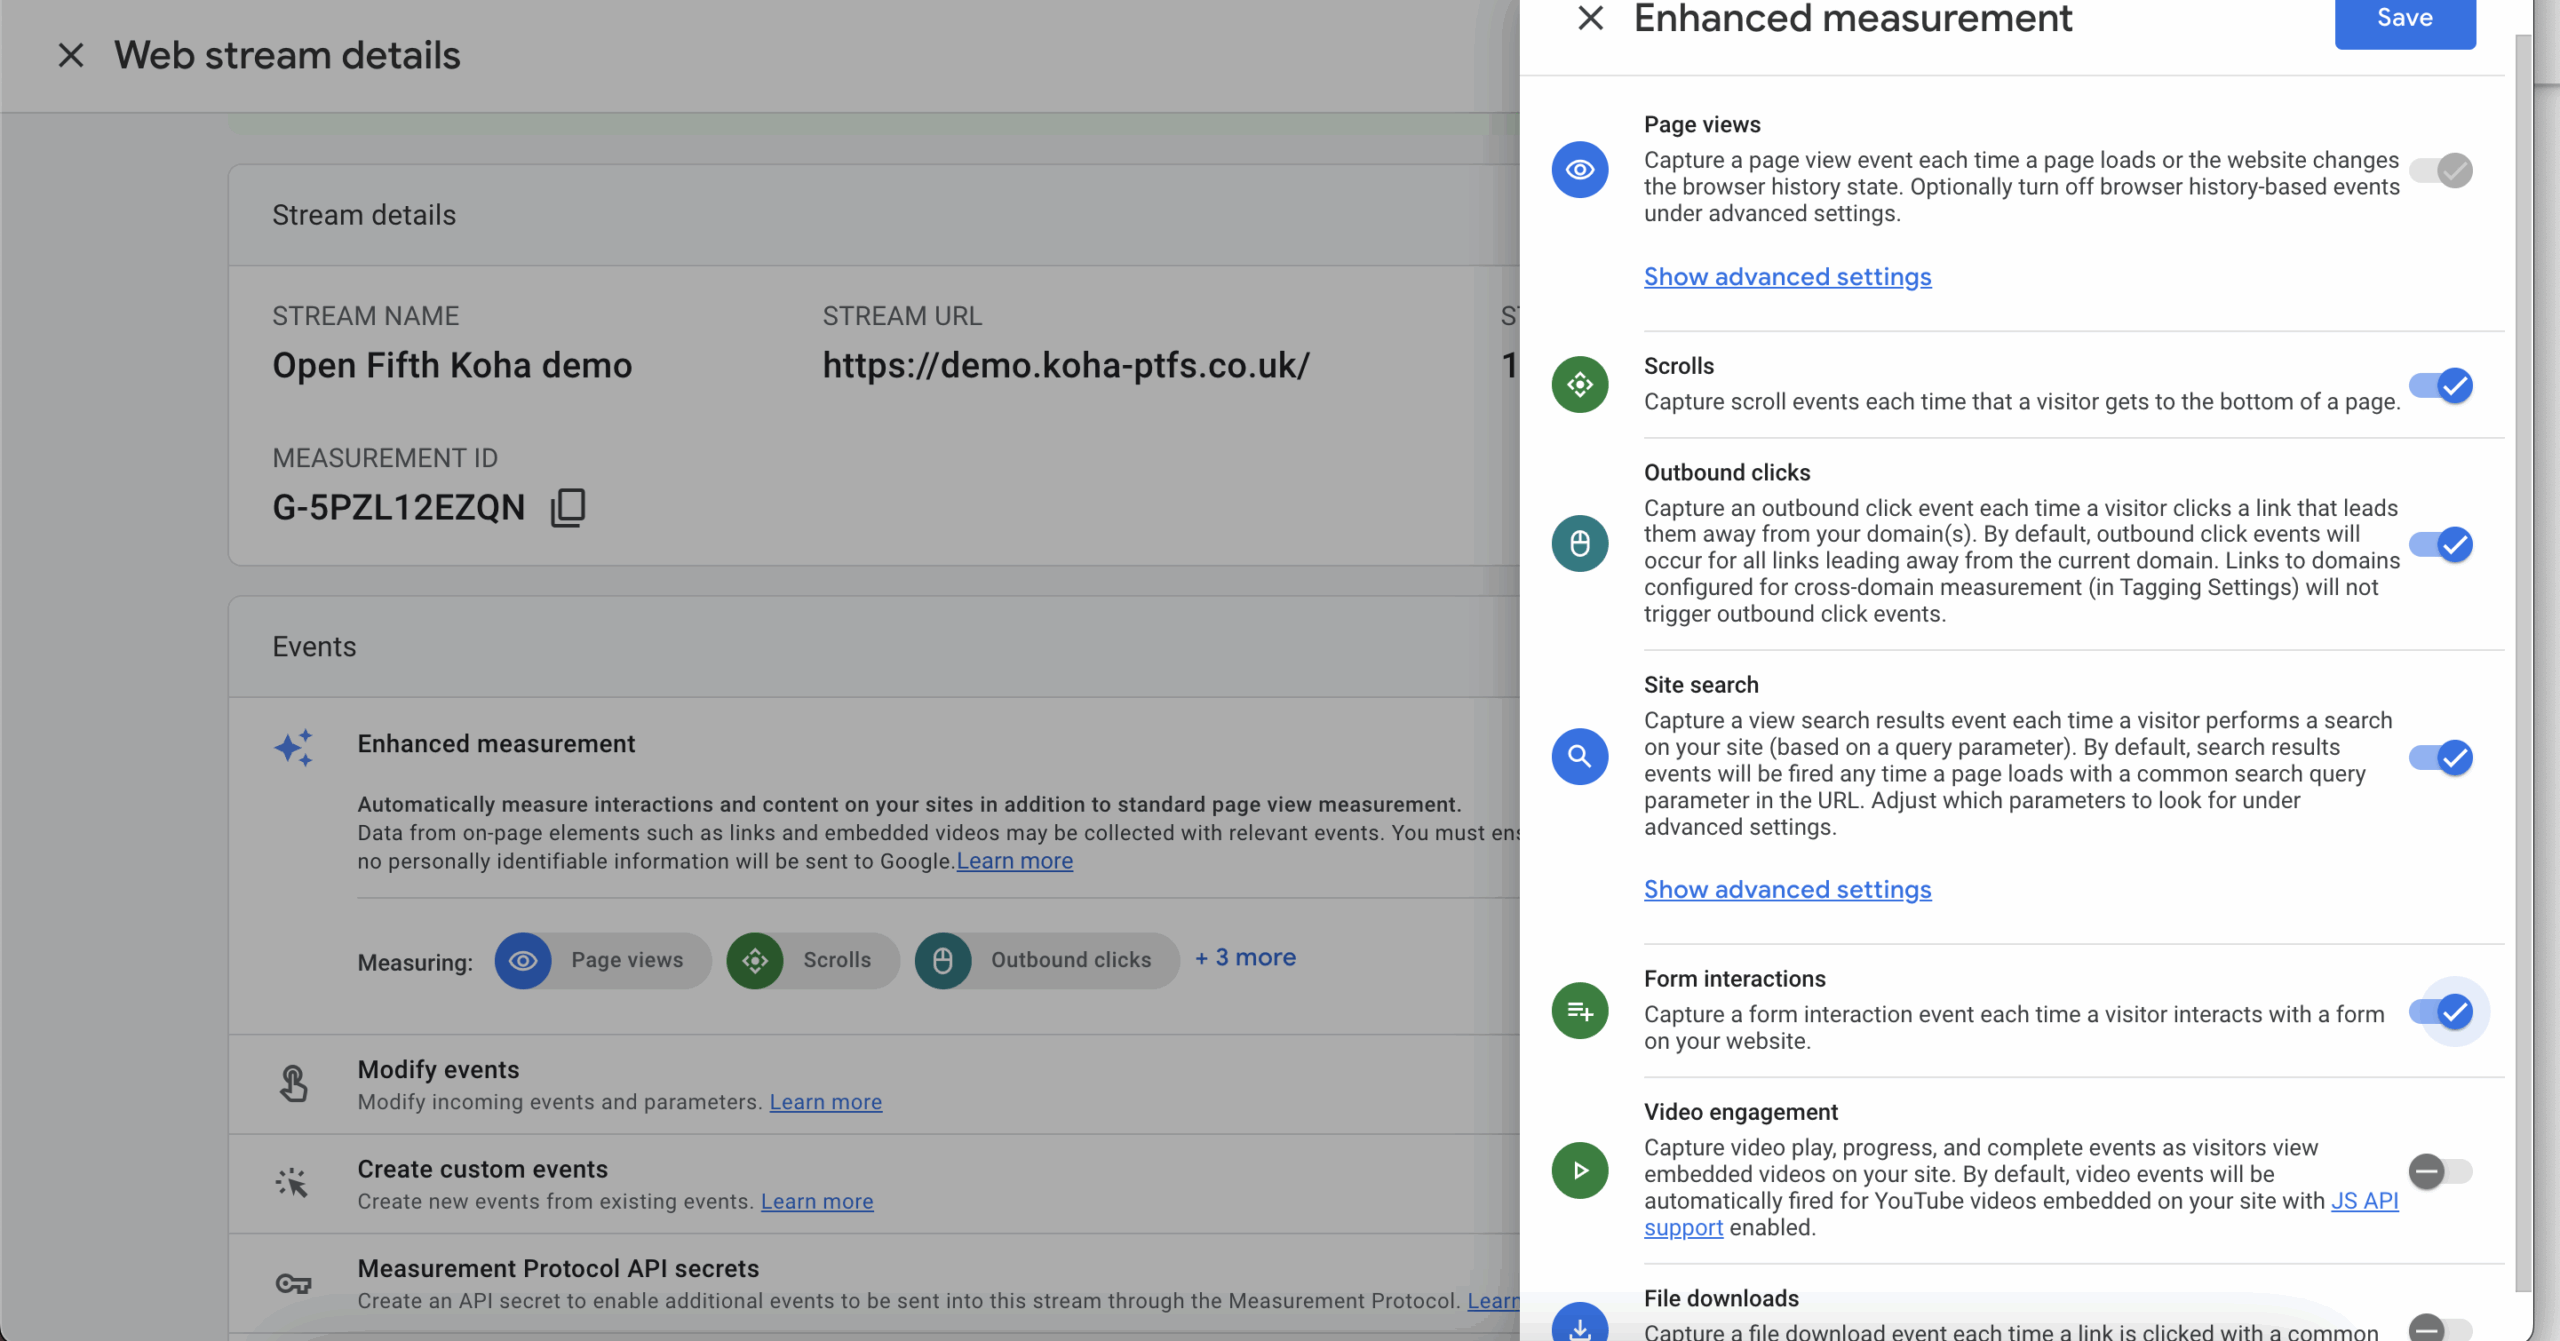
You can control the ‘Enhanced measurement’ settings to enable or disable various metrics.
Admin > Data streams > Select your stream(s)
You most likely want site search, views and form interactions enabled. You may also want to track scrolls and clicks.
It is unlikely that you’ll want file downloads or video engagement, so these can be disabled.